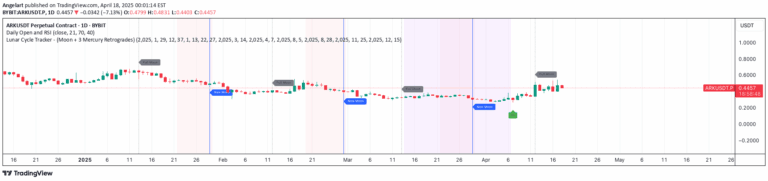
A unique TradingView indicator that overlays astrological events like moon phases and Mercury retrogrades on financial charts, helping traders visualize potential celestial market influences.
Explore complementary indicator rolesHow it works
The indicator uses precise date matching to plot specific astrological events directly on the price chart. New moons are represented by white circles, full moons by orange circles, and Mercury retrograde periods by light red background highlights. It leverages TradingView's built-in date variables to check and mark exact dates between 2013 and 2025.
The script employs plotshape() for moon events and bgcolor() for retrograde periods. Each event is carefully positioned to provide clear visualization without obscuring price action. The overlay ensures seamless integration with existing chart analysis
Why it may be useful
Astrological events can provide unique insights into market psychology and potential trend shifts. Traders interested in alternative analysis methods can use these celestial markers to complement traditional technical indicators.
Moon phases are traditionally associated with emotional market cycles, while Mercury retrograde periods are linked to potential communication and transaction disruptions. By visualizing these events, traders can develop additional context for market movements. The indicator offers a novel perspective on market behavior, bridging astronomical observations with financial analysis
When to explore it
This indicator works best for traders who incorporate astrological elements into their analysis strategy. It is most effective on daily or higher timeframes where the visual markers are clearly visible. Swing traders and long-term investors might find more value in these broader celestial patterns.
The indicator is particularly useful during periods of market uncertainty or when seeking alternative perspectives on potential trend reversals. Traders should combine these insights with traditional technical and fundamental analysis for comprehensive market evaluation
Keep exploring
What we’ve verified
Access, alerts and repainting behaviour have not been independently verified for this indicator. Check the creator’s current publication and settings.
General descriptions and classifications are recovered research. Verified details above identify the specific checks we have completed. Check the creator’s current publication for later changes.