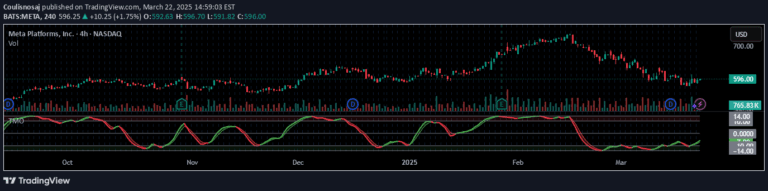
The 25-Day Momentum Index measures price movement strength over 25 days, providing visual insights into market momentum through color-coded line tracking above and below a zero reference point.
Explore complementary indicator rolesHow it works
The 25-Day Momentum Index calculates momentum by comparing the current closing price to the closing price 25 days ago, generating a numerical difference that represents market movement strength. This raw momentum value is plotted as a blue line, with a gray zero line serving as a critical reference point for interpreting market dynamics.
When the momentum line is above zero, it indicates positive momentum and is colored green, signaling upward price movement. Conversely, when the line falls below zero, it turns red, highlighting negative momentum and potential downward price trends. Traders can visually track the indicator's trajectory to understand the market's recent directional tendencies.
Why it may be useful
The 25-Day Momentum Index provides traders with a clear, visual representation of market strength that goes beyond simple price tracking. By quantifying and color-coding momentum, the indicator offers an intuitive way to understand underlying market trends and potential shifts in price movement.
This tool is particularly valuable because it helps traders quickly assess market sentiment and potential trend reversals. The visual nature of the indicator allows for rapid interpretation, enabling traders to make more informed decisions about entry and exit points based on momentum changes.
When to explore it
The 25-Day Momentum Index is most effective in markets with clear trending characteristics, where price movements demonstrate consistent directional momentum. Traders can utilize this indicator during periods of sustained market movement, whether in bullish or bearish conditions, to confirm existing trends and identify potential trend strength or weakening.
It is particularly useful when combined with other technical analysis tools, helping traders validate signals and make more comprehensive trading decisions. The indicator works best in liquid markets with sufficient price data to generate meaningful momentum calculations.
Keep exploring
What we’ve verified
Access, alerts and repainting behaviour have not been independently verified for this indicator. Check the creator’s current publication and settings.
General descriptions and classifications are recovered research. Verified details above identify the specific checks we have completed. Check the creator’s current publication for later changes.