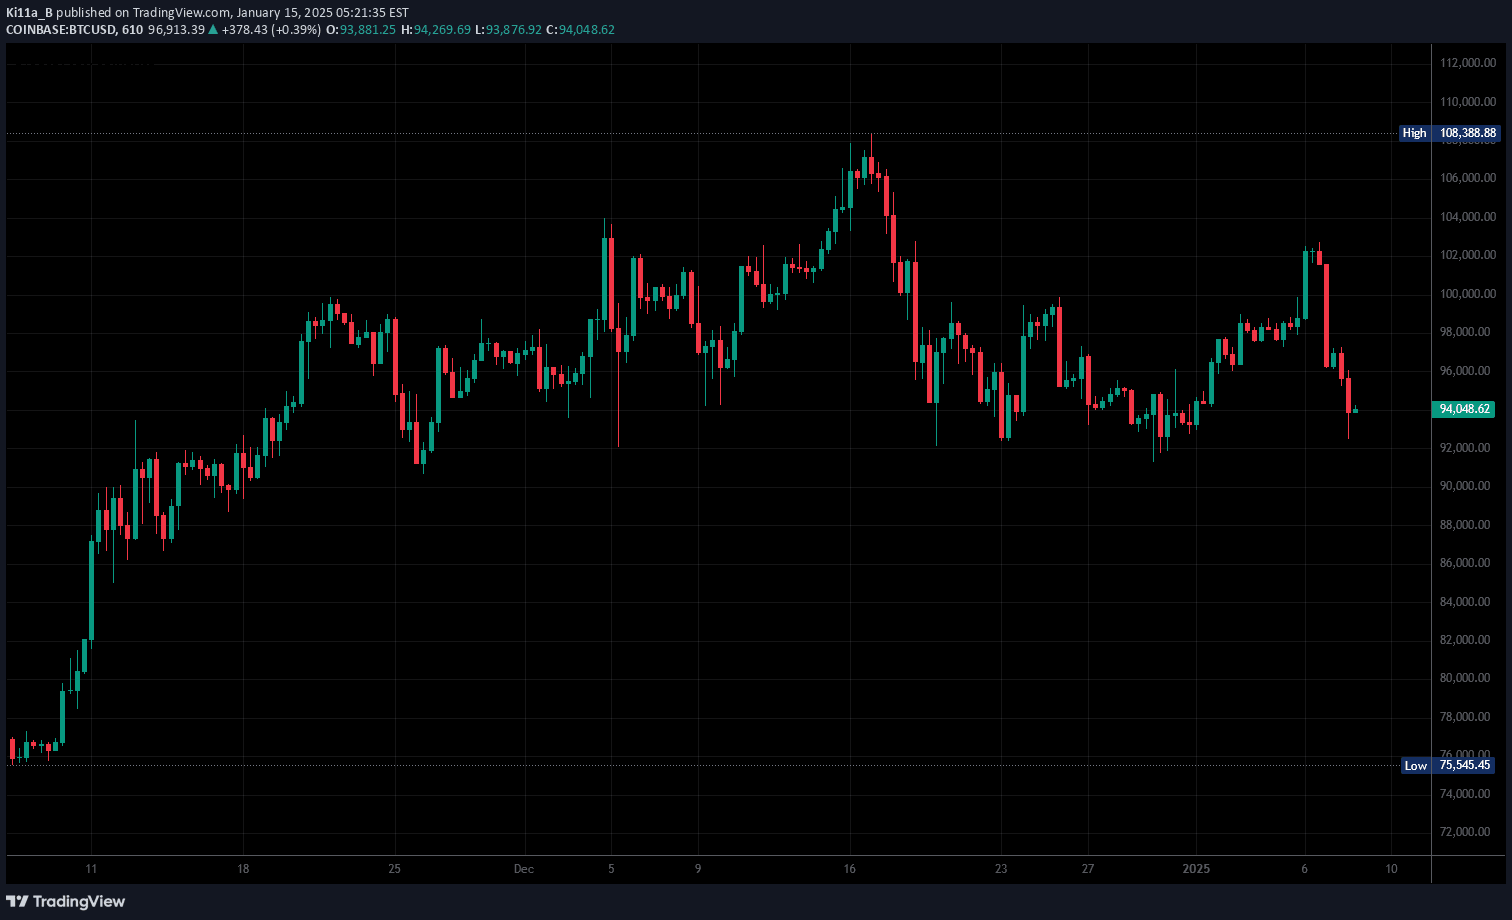
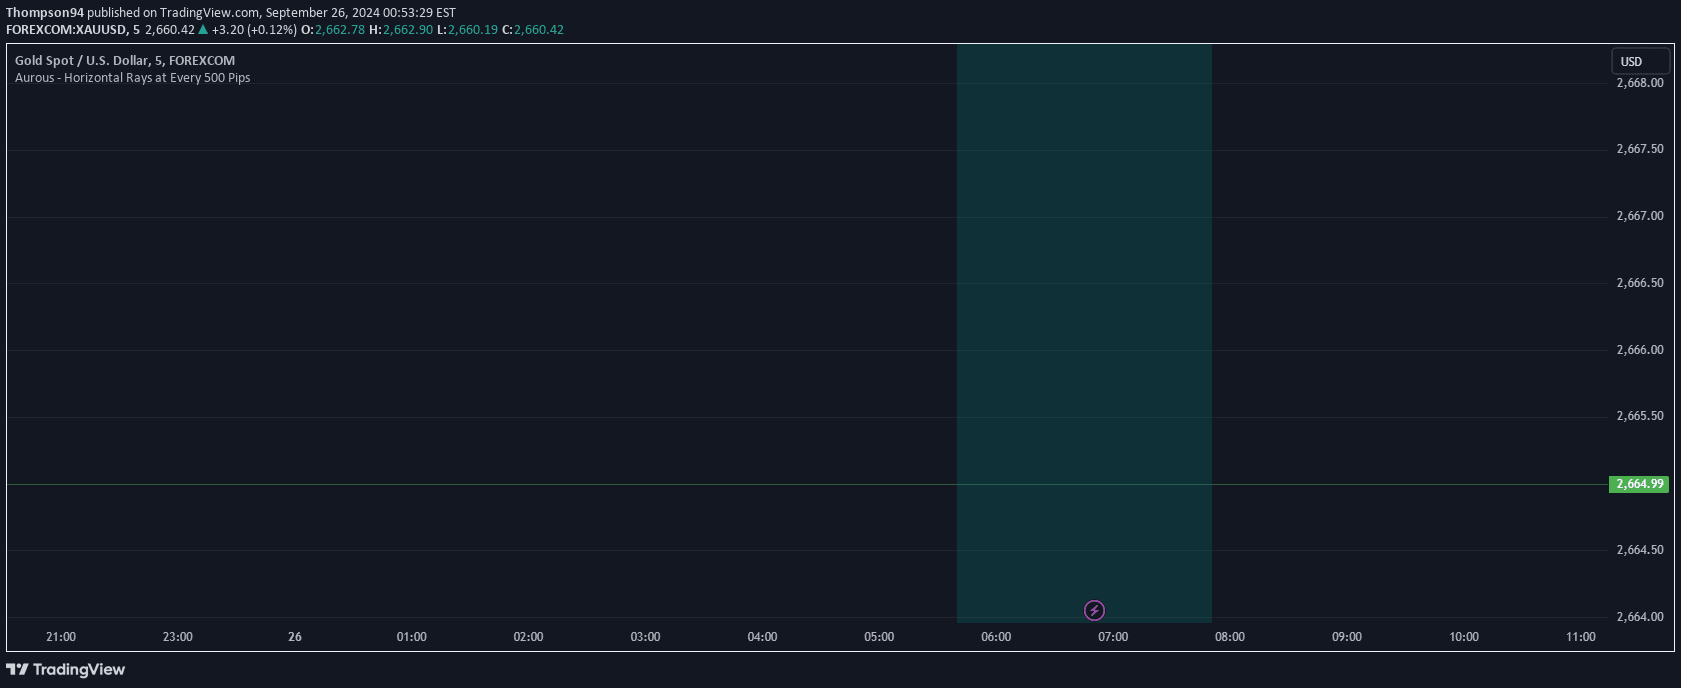
A technical indicator that plots horizontal rays based on 2x Average True Range (ATR), helping traders visualize potential support and resistance levels dynamically.
Explore complementary indicator rolesHow it works
The 2x ATR Horizontal Rays Indicator calculates the Average True Range of the previous candle and creates two horizontal lines: an upper and lower ray. These rays are positioned exactly 2x the ATR value above and below the previous candle's closing price, extending to the right side of the chart. By using the ATR, the indicator dynamically adjusts to current market volatility, with the length of the ATR period customizable by traders.
The indicator provides a visual representation of potential price boundaries based on recent market movement. As each new candle forms, the rays update, creating a continuously evolving volatility-based support and resistance framework that helps traders understand potential price interaction zones.
Why it may be useful
The 2x ATR Horizontal Rays Indicator is crucial for traders seeking to understand market volatility and potential price movement boundaries. By presenting dynamic horizontal lines based on recent price action, the indicator helps traders make more informed decisions about entry, exit, and risk management. It provides a quick visual method to assess potential support and resistance levels without complex calculations.
Moreover, the indicator's adaptability allows traders to gauge market conditions across different timeframes and asset classes. The customizable ATR length means traders can fine-tune the indicator to match specific market characteristics, making it a versatile tool for understanding price dynamics and potential trend reversals.
When to explore it
The 2x ATR Horizontal Rays Indicator is most effective in markets with clear trending or ranging characteristics. Traders can use it during periods of consistent volatility to identify potential breakout or reversal zones. It works particularly well in markets with steady directional movement, where price tends to respect volatility-based boundaries.
The indicator is especially useful when combined with other technical analysis tools, such as trend indicators or momentum oscillators. Traders can use the ATR rays to confirm potential trade setups, set stop-loss levels, or identify areas of potential price consolidation. It is particularly valuable in forex, stocks, and futures markets where understanding volatility is crucial for successful trading.
Keep exploring
What we’ve verified
Access, alerts and repainting behaviour have not been independently verified for this indicator. Check the creator’s current publication and settings.
General descriptions and classifications are recovered research. Verified details above identify the specific checks we have completed. Check the creator’s current publication for later changes.