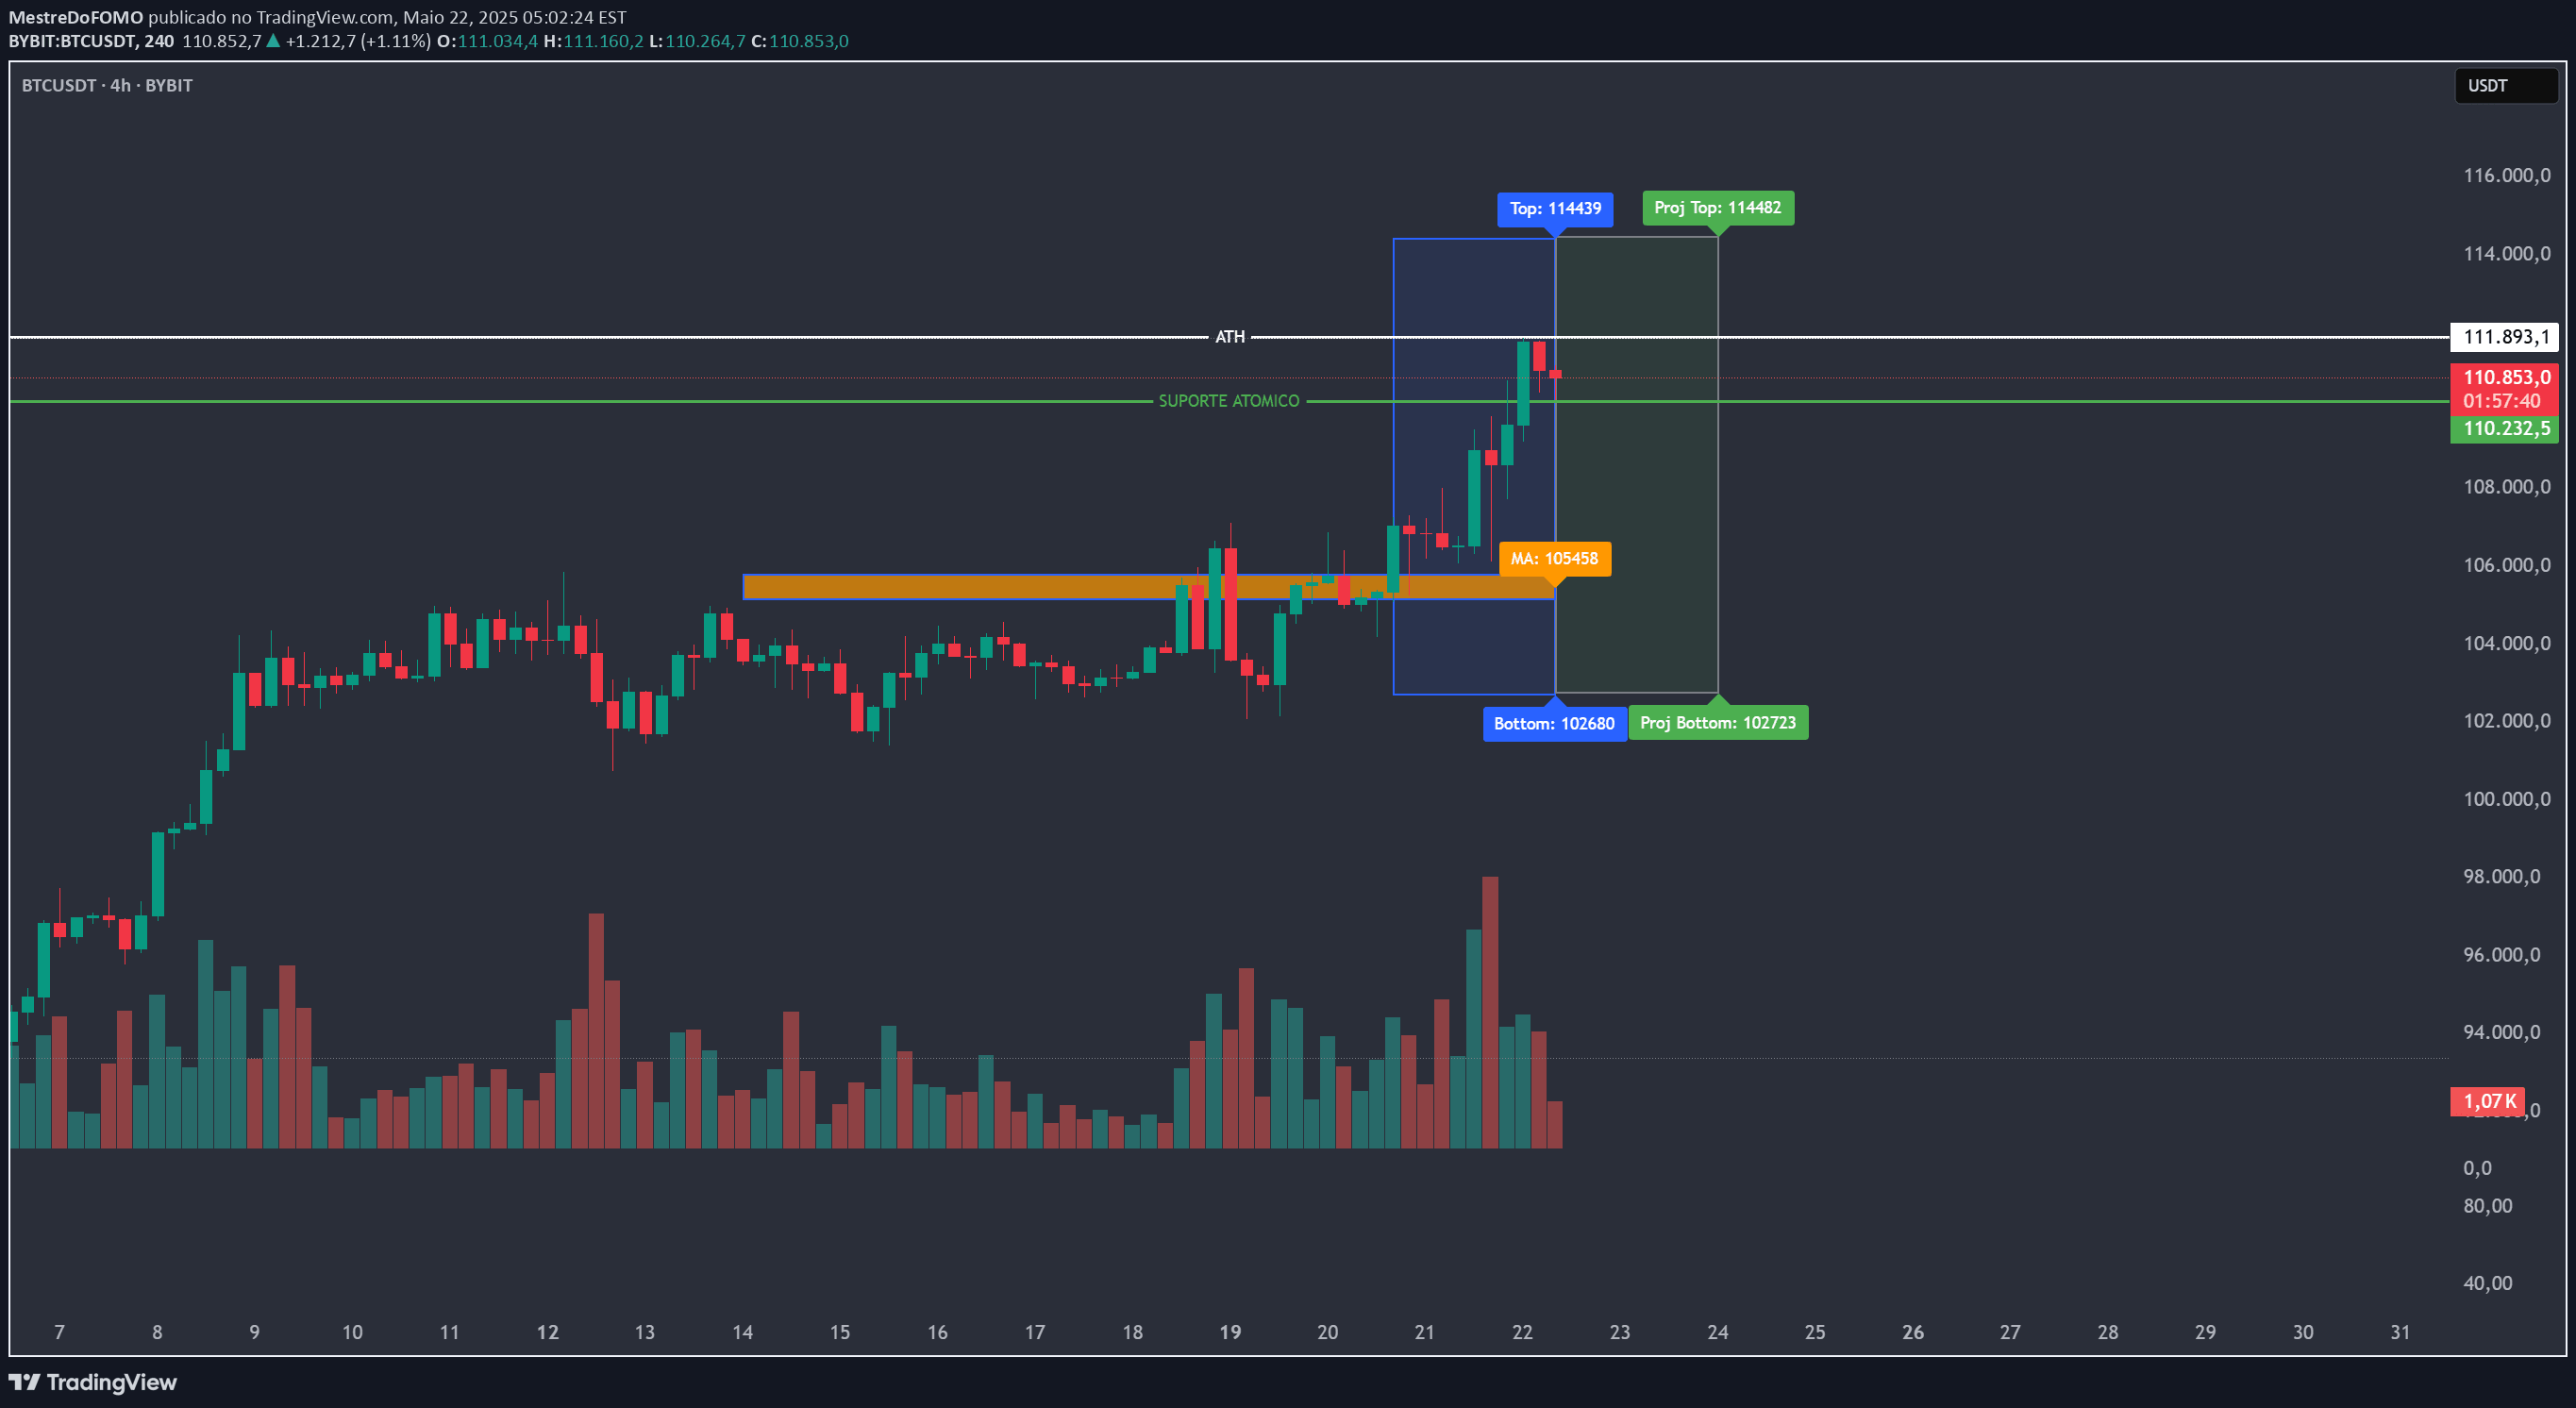
A flexible multi-timeframe box indicator with customizable parameters, showing recent price levels and potential trading zones across different time periods.
Explore complementary indicator rolesHow it works
The box indicator creates visual representations of price ranges using three distinct timeframes, typically selected as consecutive periods like previous week, yesterday, and day before. Each box is defined by its high, low, open, and close values, with a 50% midline marking the median price level.
Traders can customize the timeframes, colors, and line thicknesses to suit their specific trading style and preferences. By overlaying these boxes on the current price chart, traders can quickly identify potential support and resistance zones, compare current price action against recent historical levels, and develop more informed trading decisions.
Why it may be useful
The multi-timeframe box indicator provides traders with a comprehensive visual overview of recent price dynamics across different time periods. By presenting historical price ranges side by side, it helps traders quickly understand market context, identify potential trend continuation or reversal zones, and make more strategic entry and exit decisions.
This flexible tool allows traders to adapt the indicator to their specific trading style, market, and timeframe preferences. The customizable nature means traders can focus on the most relevant time periods for their strategy, whether they're interested in weekly, daily, or session-based price movements.
When to explore it
This box indicator is most effective during periods of range-bound or consolidating markets where clear support and resistance levels are crucial for trading decisions. It works particularly well for day traders and scalpers who need to quickly assess recent price dynamics and potential trading zones within short timeframes.
Traders should use this indicator in conjunction with other technical analysis tools to confirm signals and validate potential trade setups. It is especially useful for identifying potential breakout points, measuring recent market volatility, and understanding the current market structure across different recent time periods.
Keep exploring
What we’ve verified
Access, alerts and repainting behaviour have not been independently verified for this indicator. Check the creator’s current publication and settings.
General descriptions and classifications are recovered research. Verified details above identify the specific checks we have completed. Check the creator’s current publication for later changes.