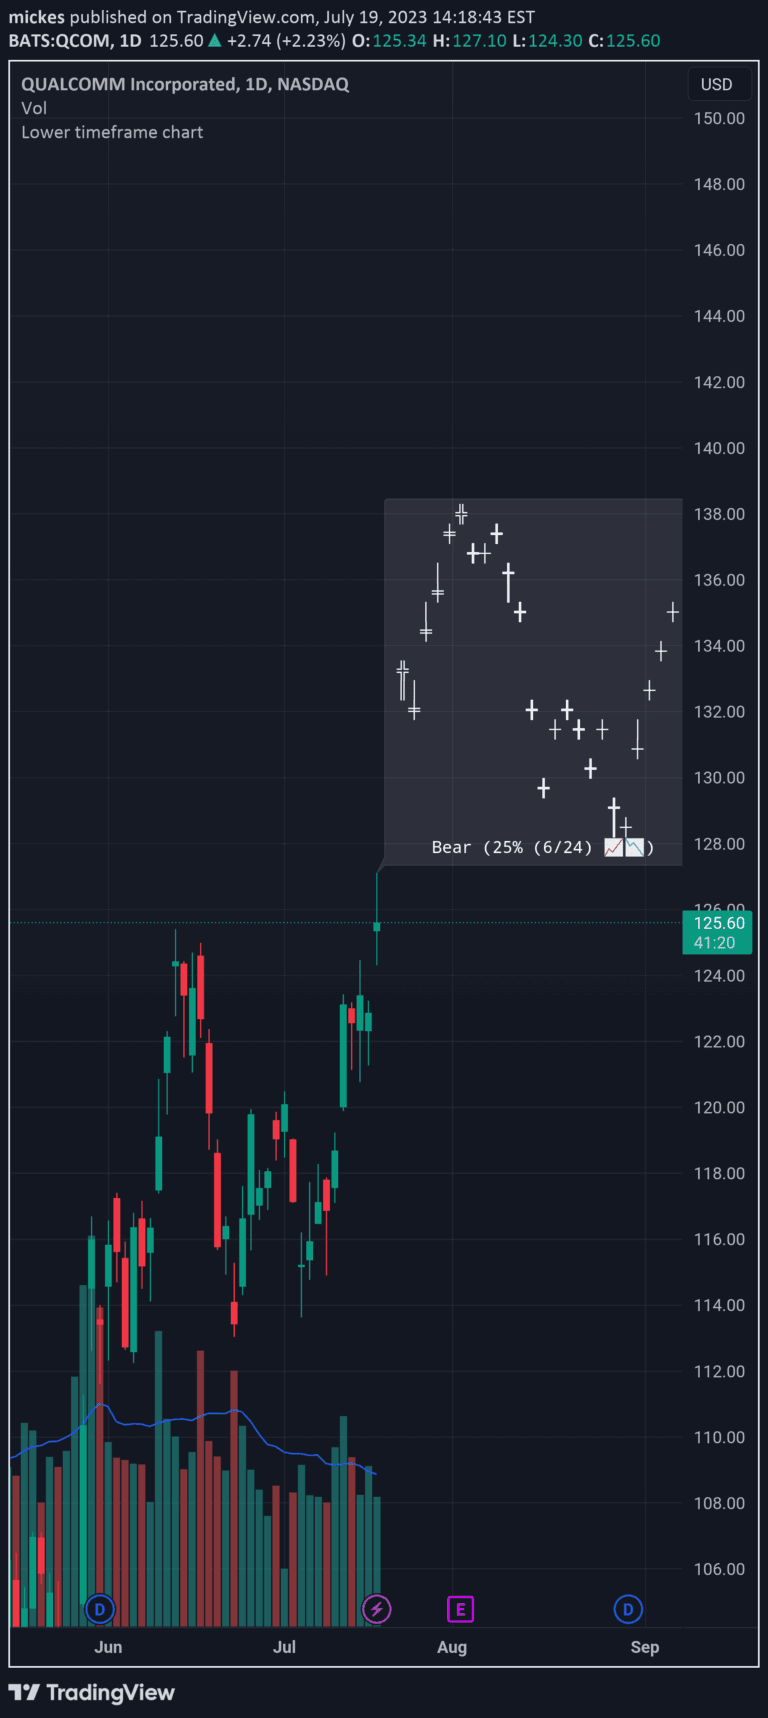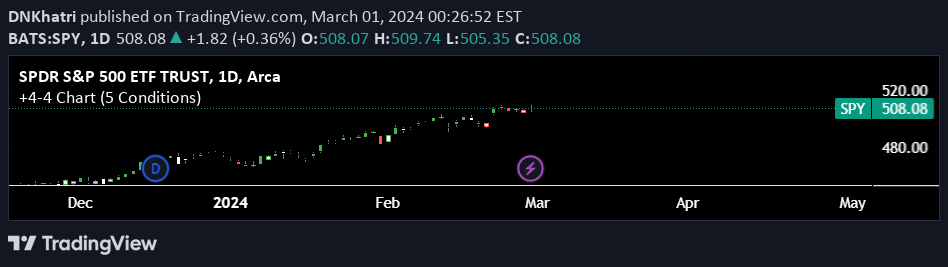
A visual overlay indicator that analyzes price momentum by comparing current bar's open, high, low, and close to previous bar's values, revealing potential market sentiment and trend direction.
Explore complementary indicator rolesHow it works
The +4-4 Chart Indicator works by systematically comparing four key price components of the current bar against the previous bar's values. It evaluates whether the open, high, low, and close are higher or lower than the preceding bar's corresponding values.
By analyzing these four price points, the indicator creates a color-coded visual representation that instantly communicates potential price momentum. Green shades indicate upward movement, while red shades suggest downward price action, allowing traders to quickly interpret the market's short-term directional bias.
Why it may be useful
This indicator provides traders with an immediate visual understanding of price momentum and potential trend strength within each trading period. By simplifying complex price movements into color-coded signals, it helps traders quickly assess market sentiment and potential directional shifts.
The +4-4 Chart Indicator allows traders to rapidly identify periods of strong trend, weak trend, or market consolidation without complex calculations. Its intuitive color-coding system transforms raw price data into an easily digestible format that can enhance decision-making and pattern recognition.
When to explore it
The +4-4 Chart Indicator is most effective when analyzing longer-term timeframes such as daily, weekly, or monthly charts for broad market instruments like SPY and QQQ. It works best in markets with clear trending characteristics, helping traders identify potential trend continuations or early reversal signals.
Traders should use this indicator in conjunction with other technical analysis tools to confirm signals and develop more comprehensive trading strategies. It is particularly useful for understanding market sentiment and identifying potential entry or exit points during trending market conditions.
Keep exploring
What we’ve verified
Access, alerts and repainting behaviour have not been independently verified for this indicator. Check the creator’s current publication and settings.
General descriptions and classifications are recovered research. Verified details above identify the specific checks we have completed. Check the creator’s current publication for later changes.