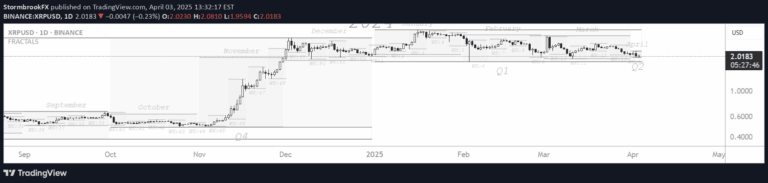
A trend reversal indicator that tracks potential market shifts by analyzing closing prices across a four-candle sequence, using visual triangular signals to indicate bullish or bearish momentum.
Explore complementary indicator rolesHow it works
The indicator operates by examining a four-candle sequence, specifically focusing on the closing price of the last candle in relation to the highs and lows of the preceding candles. It generates signals by checking whether the current closing price breaks above or below the previous candle's high and low points, which helps identify potential trend reversals.
When the closing price breaks above the prior highs, a green triangle appears above the chart, signaling bullish momentum. Conversely, when the closing price breaks below the previous lows, a red triangle appears below the chart, indicating bearish momentum. This visual representation provides traders with an immediate and clear indication of potential market direction changes.
Why it may be useful
This indicator is crucial for traders seeking to identify and capitalize on potential trend reversals across different market conditions and timeframes. By providing clear visual signals, it helps traders quickly recognize shifts in market momentum, which can be essential for making timely trading decisions and minimizing potential losses.
The versatility of this indicator makes it valuable for various trading styles, from short-term scalping to longer-term swing trading. Its ability to highlight potential trend changes can help traders adjust their strategies proactively, potentially improving entry and exit points and enhancing overall trading performance.
When to explore it
The indicator works best in markets with clear trending characteristics, where price movements show discernible directional momentum. It is particularly effective in liquid markets with sufficient trading volume, such as major forex pairs, stock indices, and prominent cryptocurrency pairs, where price movements tend to be more predictable and less erratic.
Traders should use this indicator in conjunction with other technical analysis tools to confirm signals and reduce the risk of false breakouts. Combining it with volume indicators, trend strength measures, or additional momentum oscillators can provide a more comprehensive view of market conditions and increase the reliability of trading decisions.
Keep exploring
What we’ve verified
Access, alerts and repainting behaviour have not been independently verified for this indicator. Check the creator’s current publication and settings.
General descriptions and classifications are recovered research. Verified details above identify the specific checks we have completed. Check the creator’s current publication for later changes.