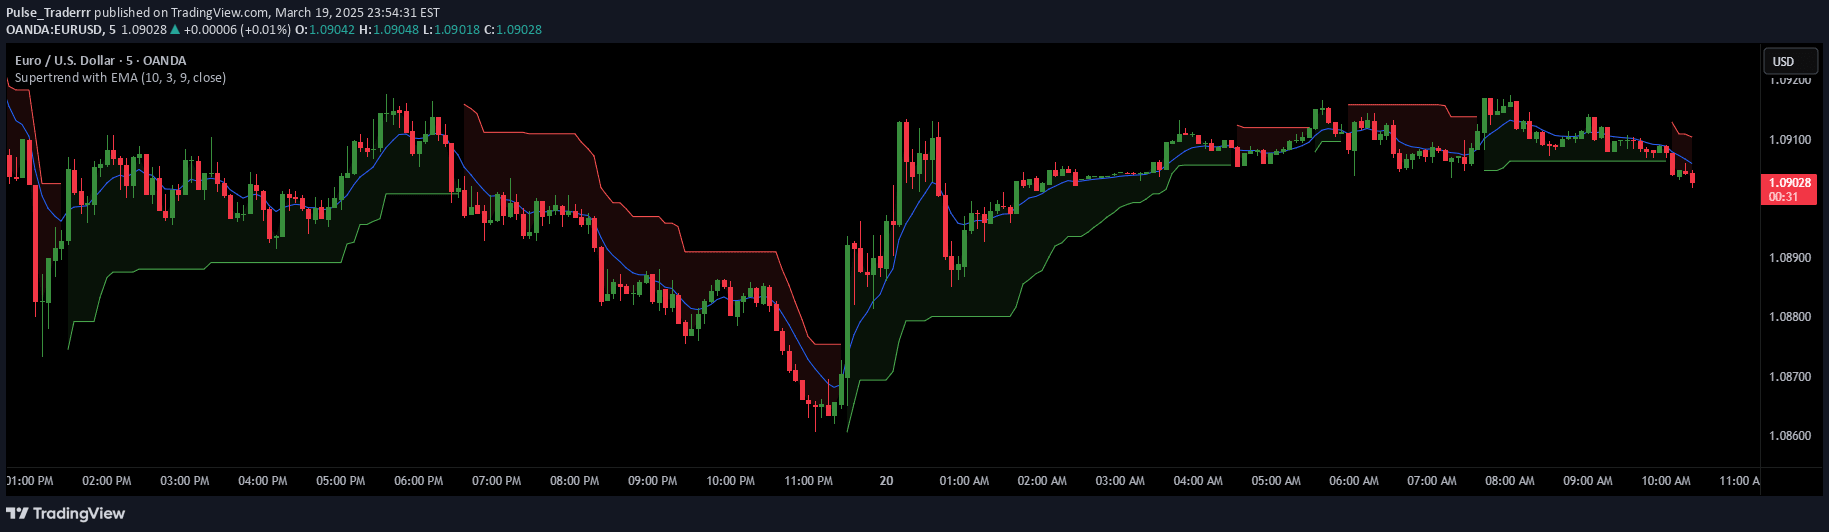
A multi-timeframe trading indicator combining four Exponential Moving Averages (EMAs) with a Supertrend indicator, offering dynamic trend analysis and crossover strategies.
Explore complementary indicator rolesHow it works
The indicator calculates four Exponential Moving Averages (EMAs) on two different timeframes, allowing traders to analyze multiple time perspectives simultaneously. Each timeframe uses its own set of four EMAs, plotted with distinct visual characteristics to help traders quickly interpret trend dynamics.
Simultaneously, the Supertrend indicator is calculated using Average True Range (ATR), providing additional trend confirmation. The Supertrend line changes color between green and red, indicating bullish or bearish market conditions, while its calculation uses adjustable parameters like multiplier and ATR period for customized trend detection.
Why it may be useful
Multi-timeframe analysis helps traders gain a more comprehensive view of market trends by comparing short-term and longer-term momentum simultaneously. By integrating EMAs from different timeframes, traders can identify potential trend confirmations, reversals, and crossover opportunities more effectively.
The added Supertrend component enhances trend identification by providing a dynamic, color-coded indicator that adapts to market volatility. This combination allows traders to make more informed decisions by understanding both the directional momentum and the overall trend strength across multiple timeframes.
When to explore it
This indicator is most effective in trending markets where clear directional movement is present, such as during strong bullish or bearish market conditions. Traders can utilize this tool when looking to confirm trend strength, identify potential entry and exit points, and validate signals across different time horizons.
The indicator is particularly useful for traders seeking a comprehensive view of market dynamics, combining multiple technical analysis tools to reduce false signals and improve trade decision-making. It works best when applied to liquid, actively traded markets with sufficient price movement to generate meaningful EMA and Supertrend signals.
Keep exploring
What we’ve verified
Access, alerts and repainting behaviour have not been independently verified for this indicator. Check the creator’s current publication and settings.
General descriptions and classifications are recovered research. Verified details above identify the specific checks we have completed. Check the creator’s current publication for later changes.