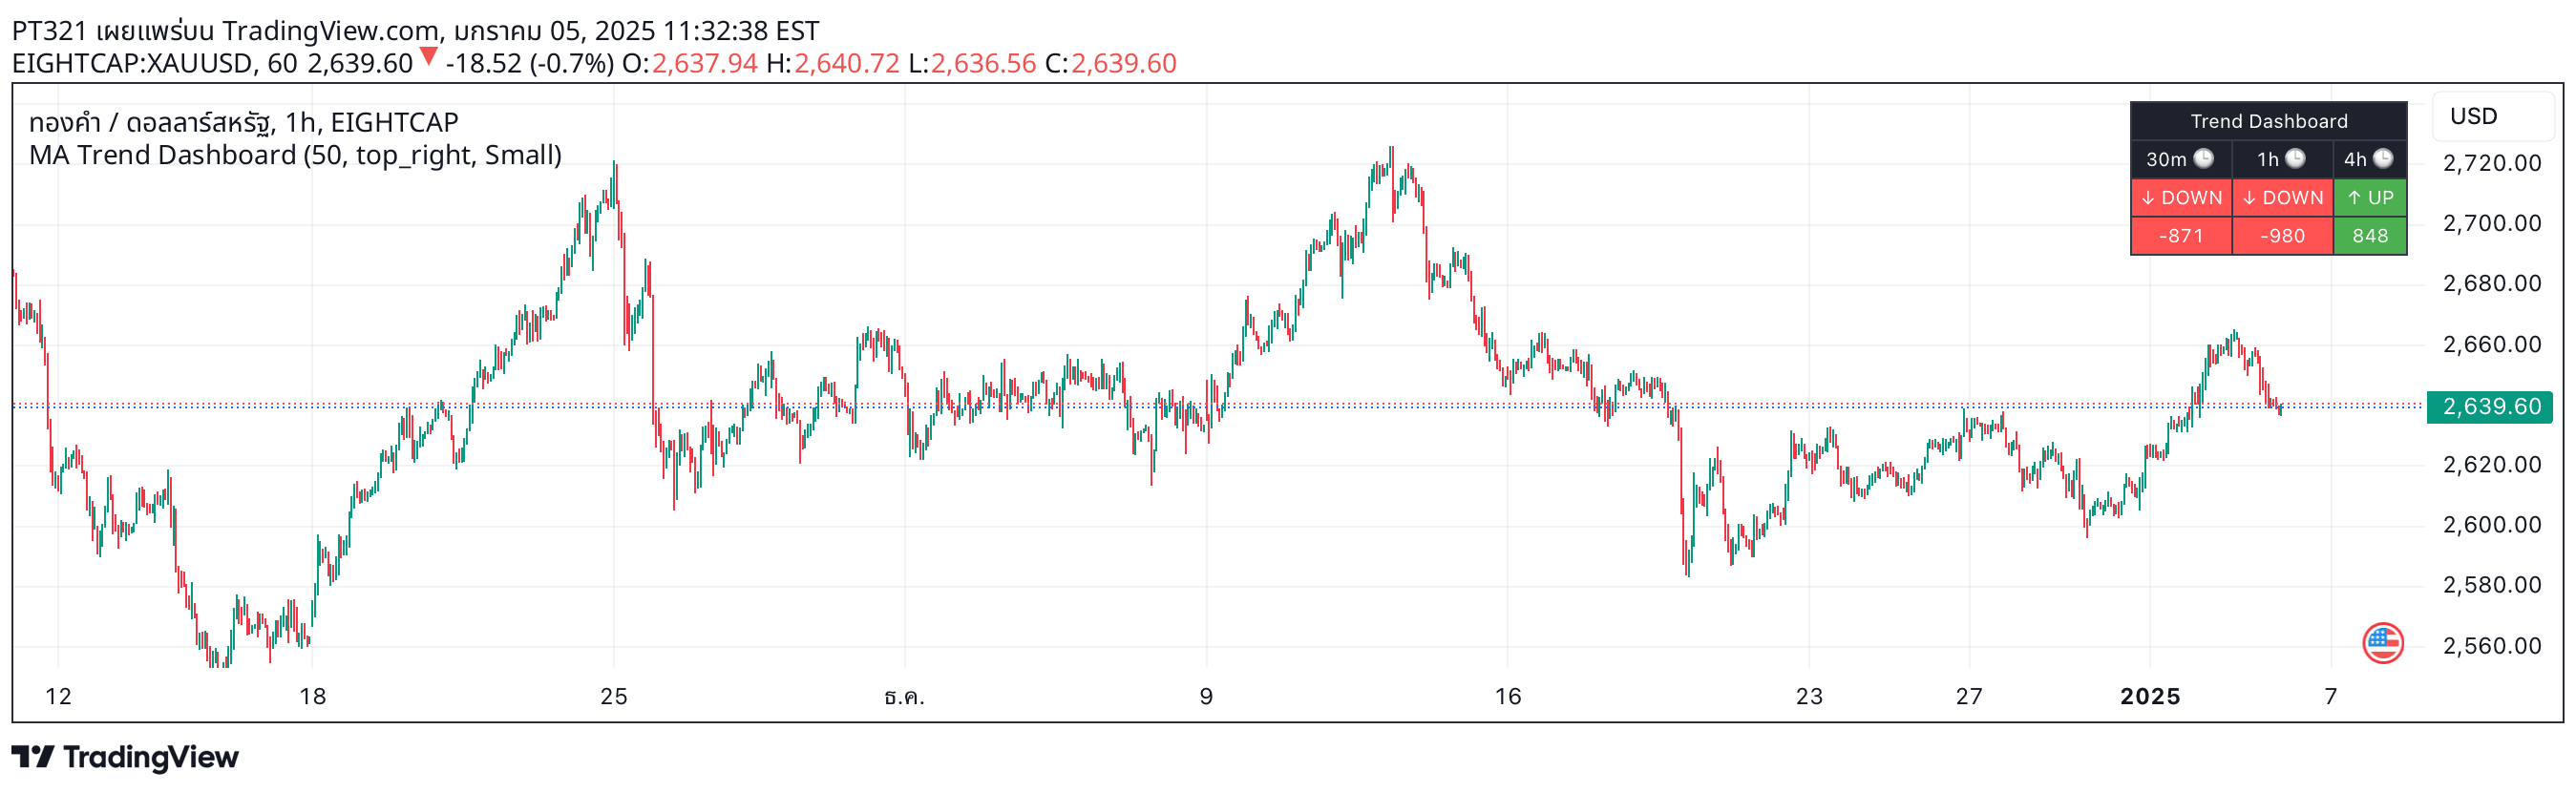
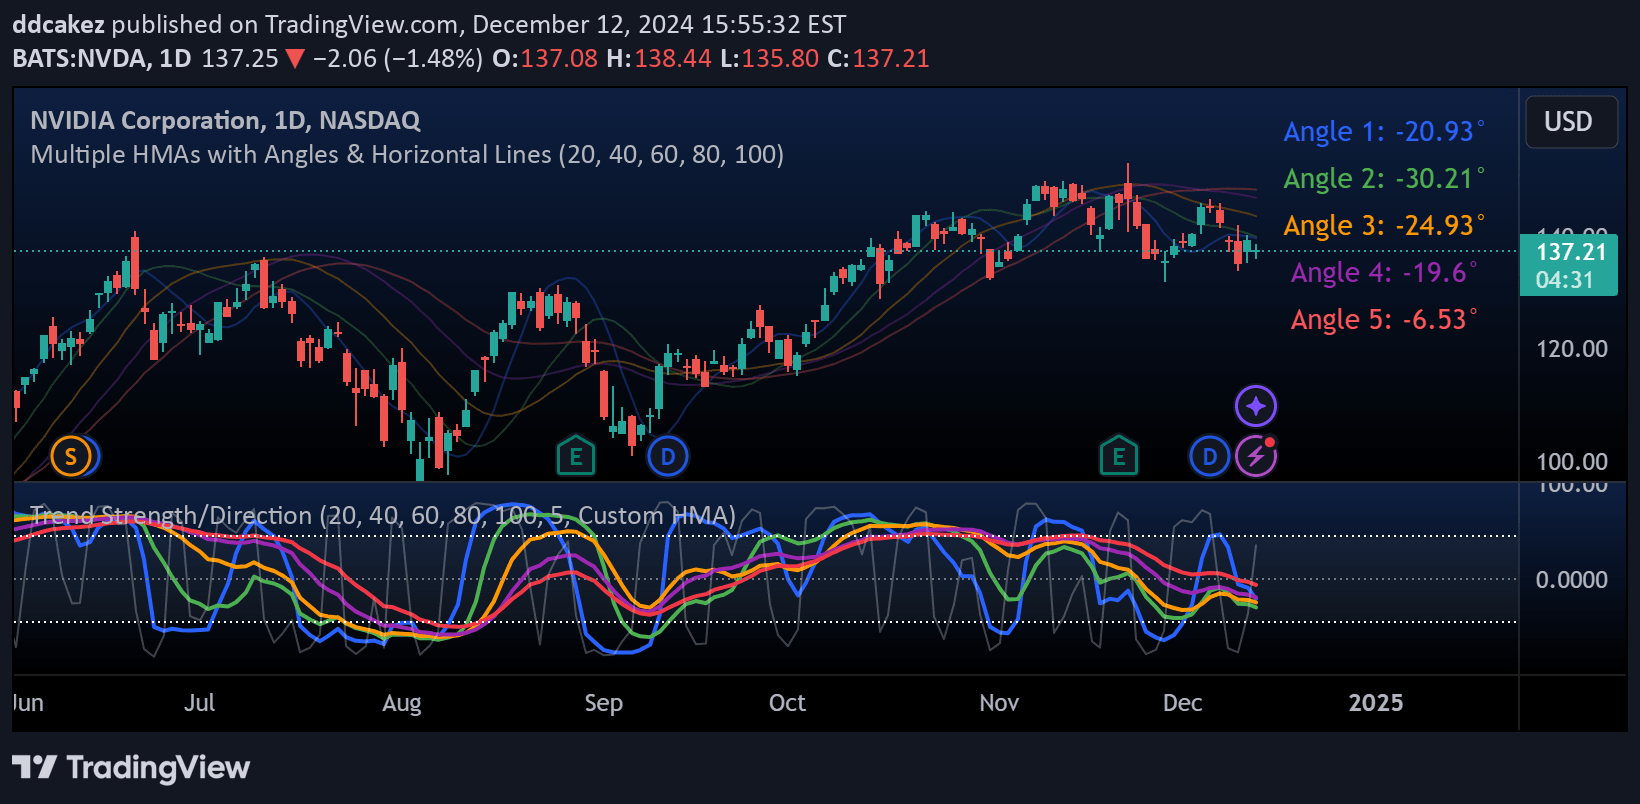
A customizable multi-symbol dashboard that tracks trend direction across 7 different symbols and 5 timeframes using moving average crossovers, providing comprehensive market trend analysis.
Explore complementary indicator rolesHow it works
The Multi-Symbol Trend Dashboard calculates trend direction by comparing fast and slow moving averages across multiple symbols and timeframes. For each symbol-timeframe combination, the system computes two moving averages with different periods, typically using either Simple (SMA), Exponential (EMA), or Weighted (WMA) moving average types.
When the faster moving average crosses above the slower moving average, the dashboard cell turns green, indicating a bullish trend. Conversely, when the faster moving average crosses below the slower moving average, the cell turns red, signaling a bearish trend. This provides traders with an immediate visual representation of trend direction across different trading instruments.
Why it may be useful
The Multi-Symbol Trend Dashboard offers traders a comprehensive market overview that eliminates the need to manually switch between multiple charts. By providing a consolidated view of trend directions across different symbols and timeframes, traders can quickly identify potential trading opportunities and maintain broader market awareness.
This tool helps traders recognize correlations and divergences between different financial instruments, enabling more informed decision-making. The color-coded display allows for rapid trend identification, reducing cognitive load and helping traders focus on high-probability trading setups across various markets simultaneously.
When to explore it
The Multi-Symbol Trend Dashboard is most effective when traders want to monitor multiple markets and timeframes concurrently. It is particularly useful for traders who follow multiple related instruments or seek to understand broader market trends across different sectors or asset classes.
This dashboard is especially valuable during periods of market transition or when analyzing potential correlations between different financial instruments. Traders can use it to validate trend consistency across various timeframes, identify potential entry points, and maintain a holistic view of market conditions without constant manual chart switching.
Keep exploring
What we’ve verified
Access, alerts and repainting behaviour have not been independently verified for this indicator. Check the creator’s current publication and settings.
General descriptions and classifications are recovered research. Verified details above identify the specific checks we have completed. Check the creator’s current publication for later changes.