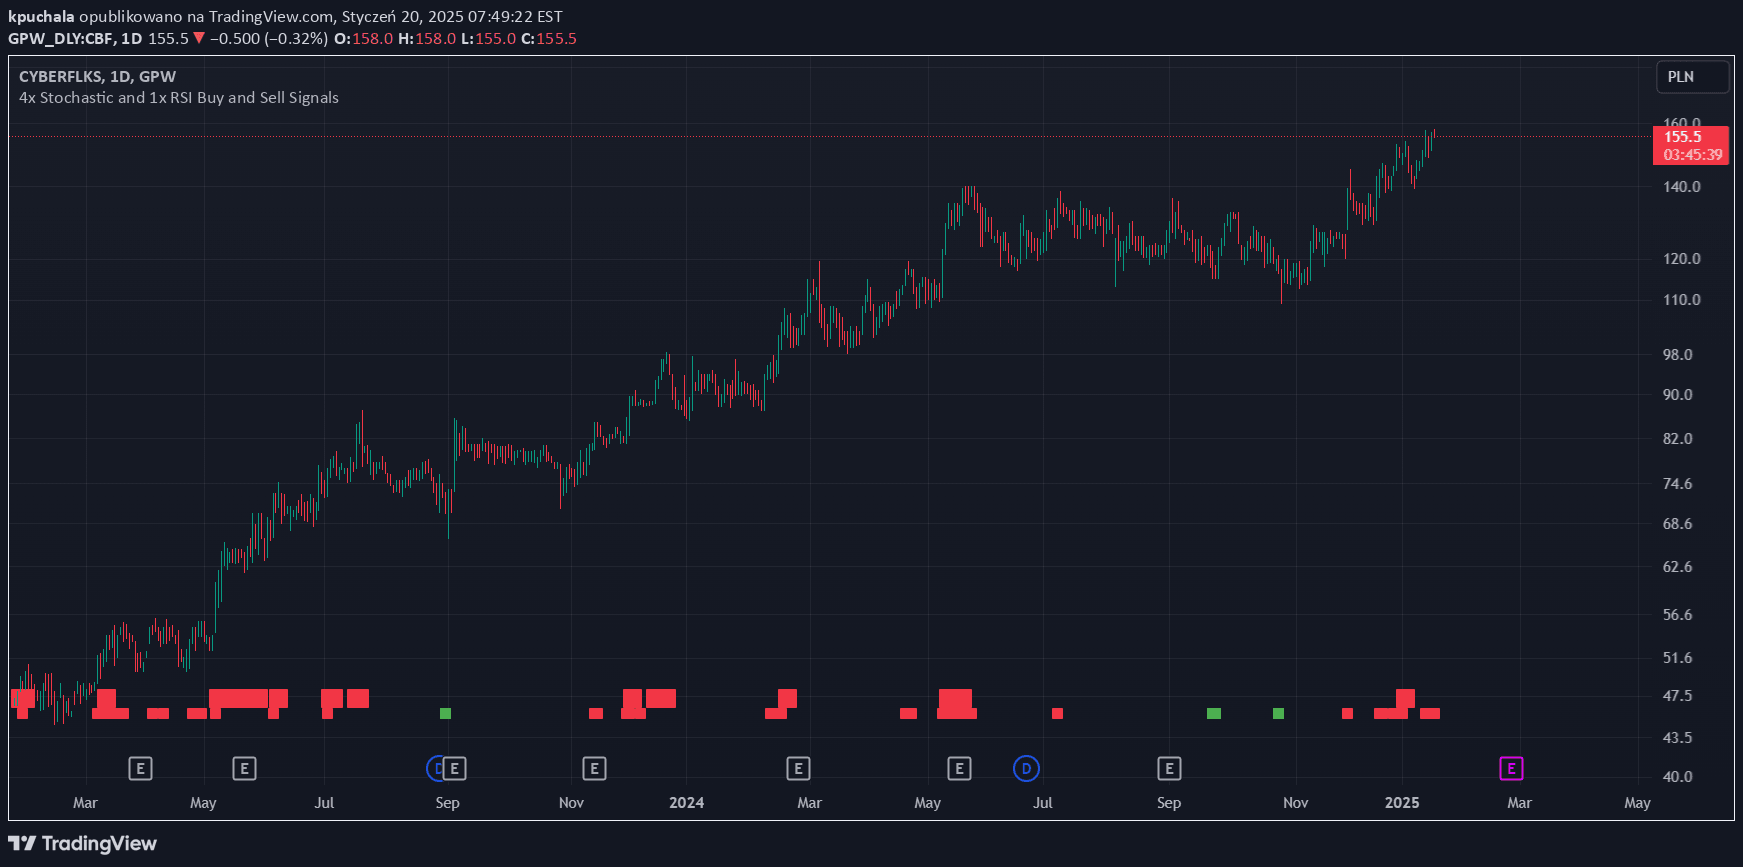
A trading signal using Stochastic and optional RSI indicators to identify potential buy and sell opportunities based on specific oscillator level thresholds.
Explore complementary indicator rolesHow it works
The trading signal operates by analyzing Stochastic oscillator values across multiple timeframes (9, 14, 40, and 60). When all Stochastic indicators are below 20, it generates a buy signal, and when they are above 80, it creates a sell signal. An optional RSI confirmation can enhance the signal's reliability.
For buy signals, RSI below 30 adds additional strength, while sell signals are reinforced when RSI exceeds 70. Traders should use these signals in conjunction with other technical analysis tools like support/resistance levels, exponential moving averages, and fundamental analysis to increase trading accuracy.
Why it may be useful
This signal helps traders identify potential market entry and exit points by leveraging multiple oscillator measurements. By combining Stochastic readings across different timeframes, traders can gain a more comprehensive view of market momentum and potential trend reversals.
The optional RSI confirmation adds an extra layer of validation, reducing false signals and improving trade decision-making. Integrating this approach with other technical indicators allows traders to develop a more robust and nuanced trading strategy.
When to explore it
The signal is most effective in markets with clear trending or ranging characteristics, where oscillators can provide meaningful insights into momentum shifts. It works best in liquid markets with consistent price movements, such as major forex pairs, stock indices, and prominent cryptocurrencies.
Traders should apply this signal during periods of moderate market volatility and avoid using it during extreme market conditions or news-driven price spikes. Combining the signal with additional confirmation from support/resistance levels and fundamental analysis can significantly enhance its predictive power.
Keep exploring
What we’ve verified
Access, alerts and repainting behaviour have not been independently verified for this indicator. Check the creator’s current publication and settings.
General descriptions and classifications are recovered research. Verified details above identify the specific checks we have completed. Check the creator’s current publication for later changes.