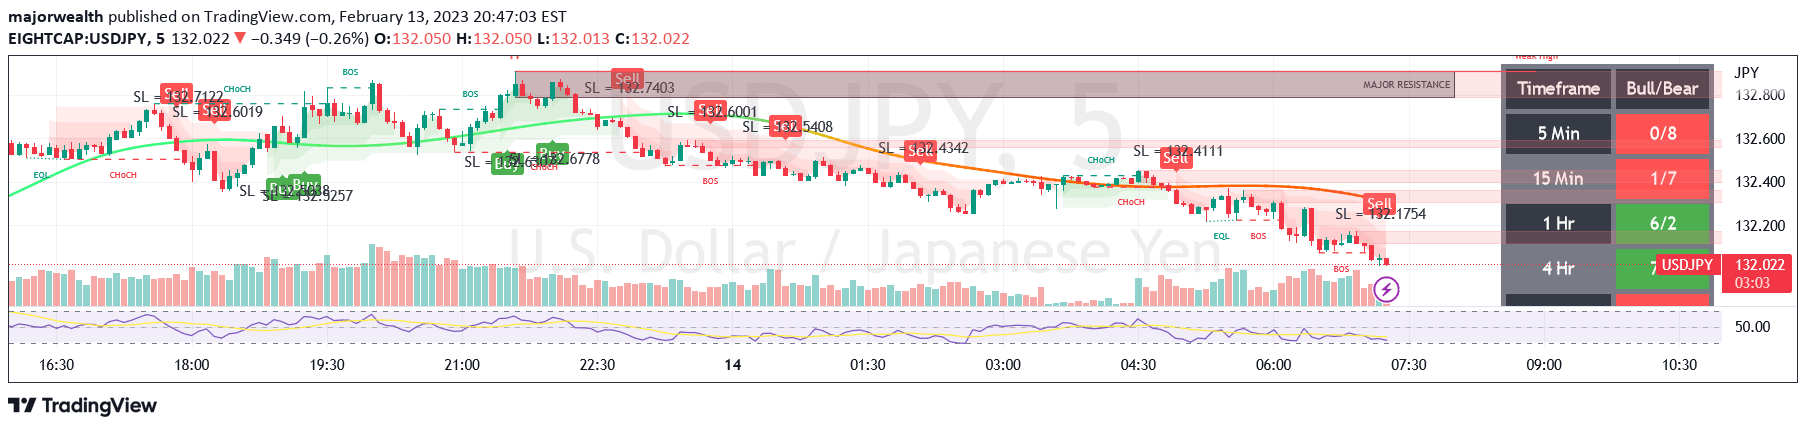
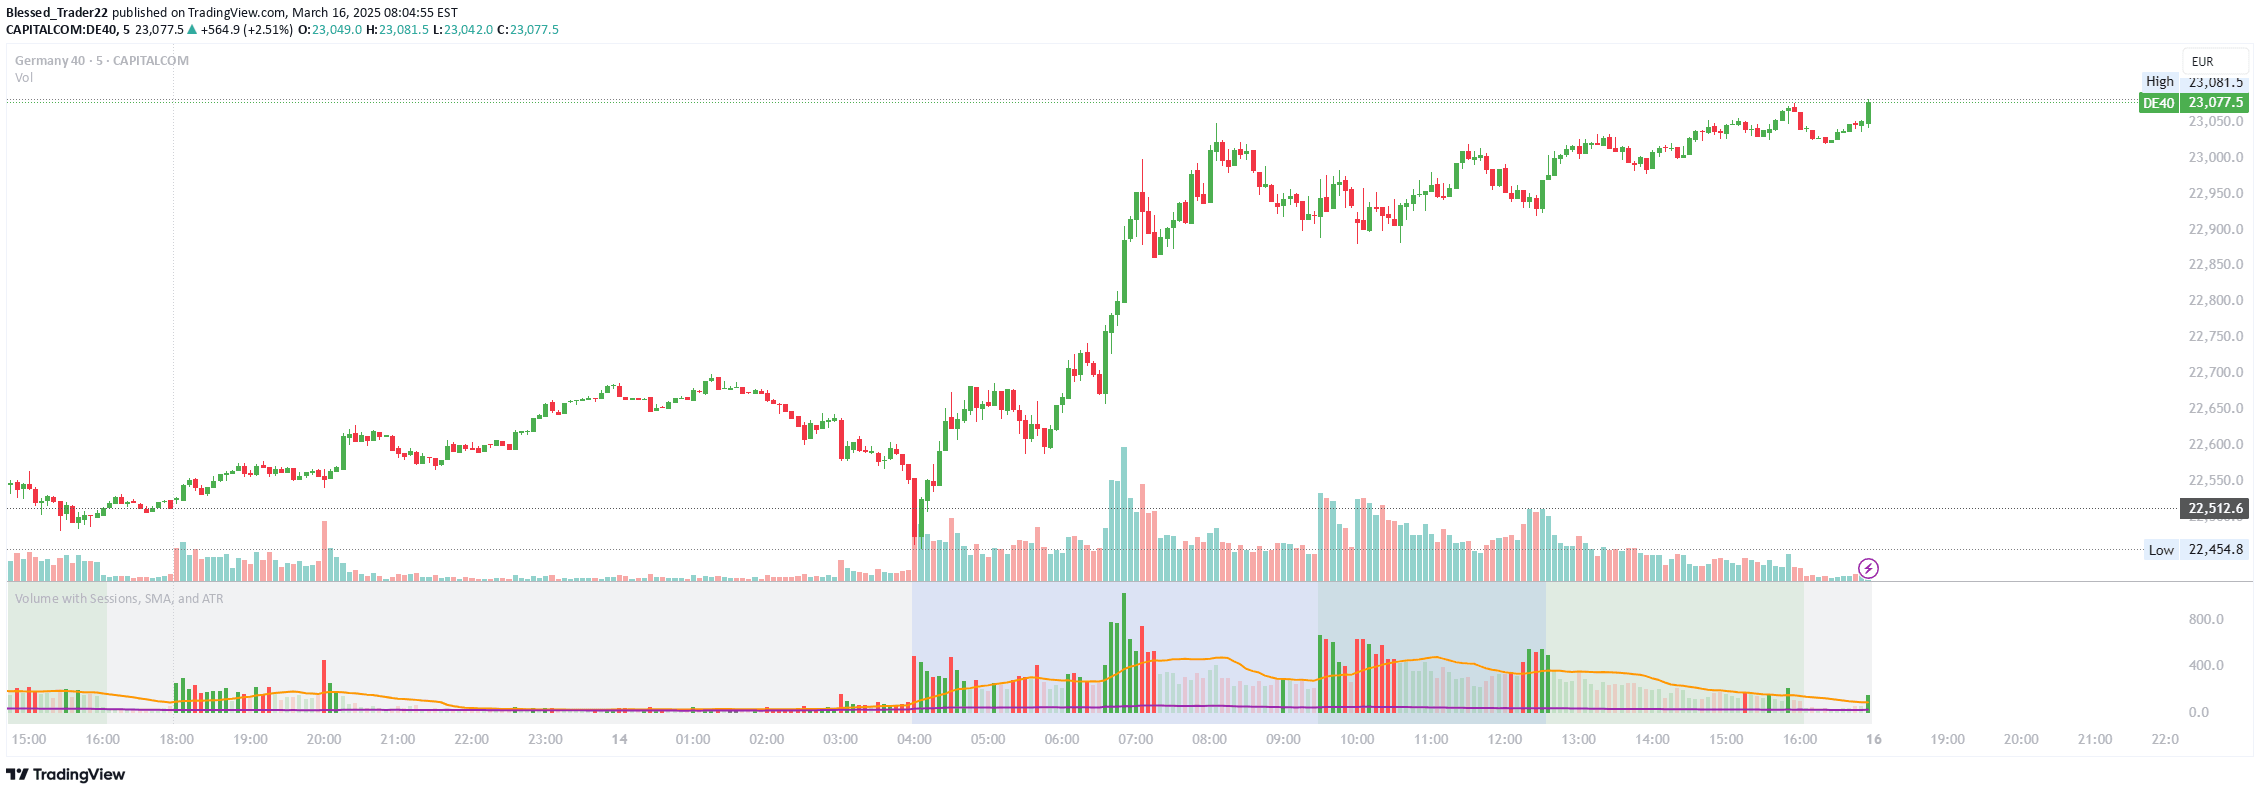
A momentum-based breakout signal that identifies trend continuation by detecting when a green candle closes above the 5-day Simple Moving Average for the first time after being below it.
Explore complementary indicator rolesHow it works
The 5 DMA (Close Above) signal operates by monitoring price action in relation to the 5-day Simple Moving Average. When a green bullish candle closes above this moving average for the first time after previously being below it, the indicator generates a buy signal. This method tracks price momentum and potential trend resumption by identifying key breakthrough moments.
The signal is designed to be conservative, only triggering once per trend leg and resetting when price closes back below the 5-day moving average. By focusing on actual price closure rather than just momentary touches, the indicator provides a more reliable entry confirmation for traders seeking trend continuation opportunities.
Why it may be useful
The 5 DMA (Close Above) signal matters because it offers traders a simple yet effective method to identify potential trend resumption with minimal complexity. By focusing on price action relative to a short-term moving average, it helps traders capture early momentum shifts without relying on complicated technical analysis.
This approach provides a clear, objective entry criteria that reduces emotional decision-making and helps traders systematically identify high-probability trade setups. The signal's built-in alert mechanism also enables real-time notifications, allowing traders to act quickly on emerging opportunities.
When to explore it
The 5 DMA (Close Above) signal works best in trending markets with clear directional movement, particularly during periods of moderate volatility. It is most effective when price has experienced a pullback or consolidation and shows signs of resuming the previous trend direction. Traders should preferably use this signal on liquid, higher-timeframe charts to increase reliability.
The indicator is particularly useful for traders seeking early entry points in potential trend continuation scenarios. It performs well across various markets, including stocks, forex, and cryptocurrencies, but should be combined with other confirmatory indicators to enhance trade probability and risk management.
Keep exploring
What we’ve verified
Access, alerts and repainting behaviour have not been independently verified for this indicator. Check the creator’s current publication and settings.
General descriptions and classifications are recovered research. Verified details above identify the specific checks we have completed. Check the creator’s current publication for later changes.