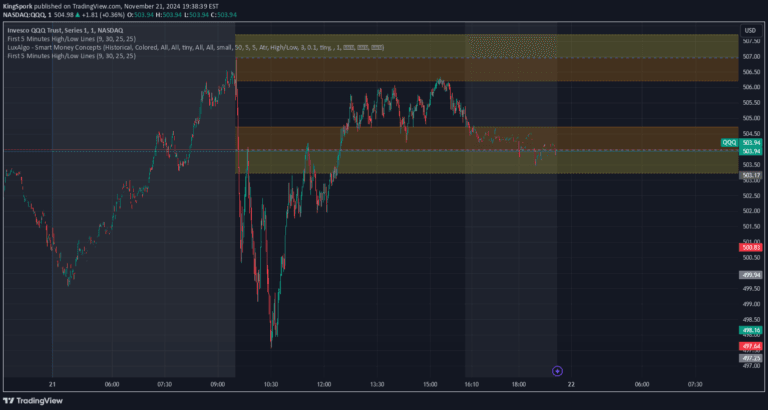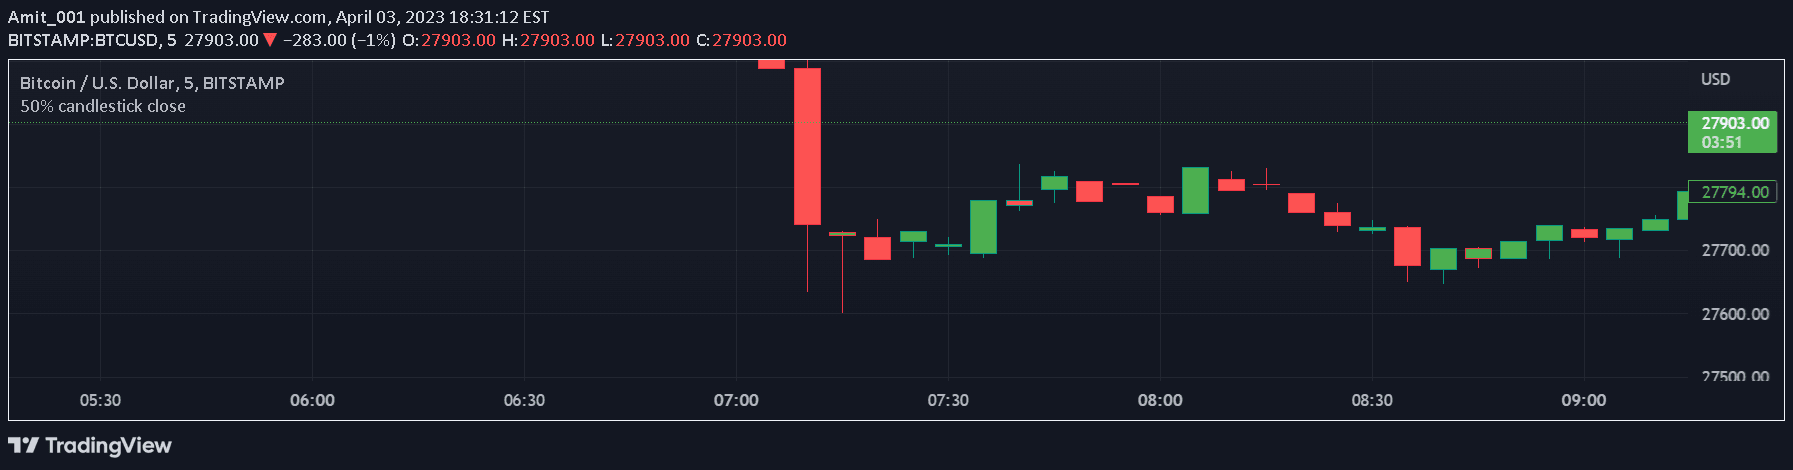
A trading signal focusing on candlestick positioning at key support and resistance levels to generate entry and exit points with clear stop-loss strategies.
Explore complementary indicator rolesHow it works
This signal operates by analyzing candlestick positions relative to key market levels like support and resistance. Traders identify important price zones and then evaluate the candlestick's close position within its range to determine potential trade entries. When a candlestick closes above 50% of its range at a support level, it suggests a potential bullish setup for buying.
Conversely, at resistance levels, a candlestick closing below 50% of its range indicates a potential bearish setup for selling. The stop-loss is strategically placed at the low of the bullish candlestick or the high of the bearish candlestick, providing a clear risk management approach.
Why it may be useful
This signal provides traders with a systematic approach to entering trades at critical market levels with precise entry and exit criteria. By focusing on candlestick positioning, traders can make more informed decisions based on price action and momentum at key support and resistance zones. The method offers a structured way to interpret market sentiment and potential trend reversals.
Moreover, the clear stop-loss strategy inherent in this signal helps traders manage risk effectively. By using the candlestick's own extremes as stop-loss points, traders can define their potential loss before entering a trade, which is crucial for maintaining disciplined and consistent trading performance.
When to explore it
This signal is most effective in markets with clear, well-defined support and resistance levels, such as trending or range-bound markets. It works best when traders have already identified significant price zones through technical analysis or previous market structure. The approach is particularly useful in volatile markets where price action provides clear signals about potential trend changes.
Traders should apply this signal in timeframes that allow for clear candlestick formations, typically intraday or short-term charts. It is especially valuable for active traders who want a rule-based approach to entering trades with predefined risk parameters. The signal is less effective in extremely choppy or low-volatility market conditions where clear candlestick patterns are harder to identify.
Keep exploring
What we’ve verified
Access, alerts and repainting behaviour have not been independently verified for this indicator. Check the creator’s current publication and settings.
General descriptions and classifications are recovered research. Verified details above identify the specific checks we have completed. Check the creator’s current publication for later changes.