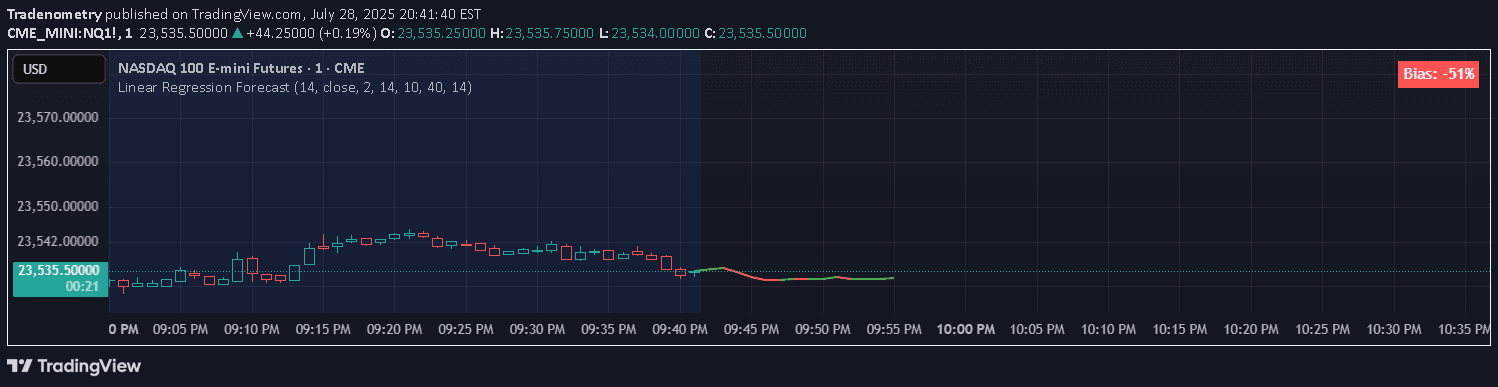
A trading signal that uses linear regression and forecasting to predict price movement over a 6-hour period, providing directional arrows and confidence intervals for potential market trends.
Explore complementary indicator rolesHow it works
The signal employs a linear regression technique to analyze historical price data and predict future price movements. By calculating the slope and standard deviation of price data over a specified number of bars, the script creates a mathematical model that extrapolates potential price trajectories.
For each 15-minute interval over a 6-hour forecast period, the script generates predicted price points and computes a 95% confidence interval. This process involves extending the historical regression line and estimating potential price variations, allowing traders to visualize potential market direction and volatility.
Why it may be useful
Linear regression forecasting provides traders with a statistical approach to understanding potential market movements, offering insights beyond traditional technical analysis methods. By quantifying price trends and potential variations, traders can make more informed decisions about market entry and exit points.
The signal's ability to generate directional arrows and confidence intervals helps traders assess market uncertainty and potential price ranges. This approach transforms complex mathematical calculations into visual, easily interpretable signals that can enhance trading strategy and risk management.
When to explore it
This signal is most effective in markets with relatively consistent trends and moderate volatility, where historical price patterns can provide meaningful predictive insights. It works best in timeframes ranging from intraday to short-term trading, particularly for assets with clear directional movements.
Traders should use this signal as a complementary tool alongside other technical and fundamental analysis methods. It is particularly useful for day traders seeking to understand potential short-term price movements and assess market momentum within a structured, statistically-grounded framework.
Keep exploring
What we’ve verified
Access, alerts and repainting behaviour have not been independently verified for this indicator. Check the creator’s current publication and settings.
General descriptions and classifications are recovered research. Verified details above identify the specific checks we have completed. Check the creator’s current publication for later changes.