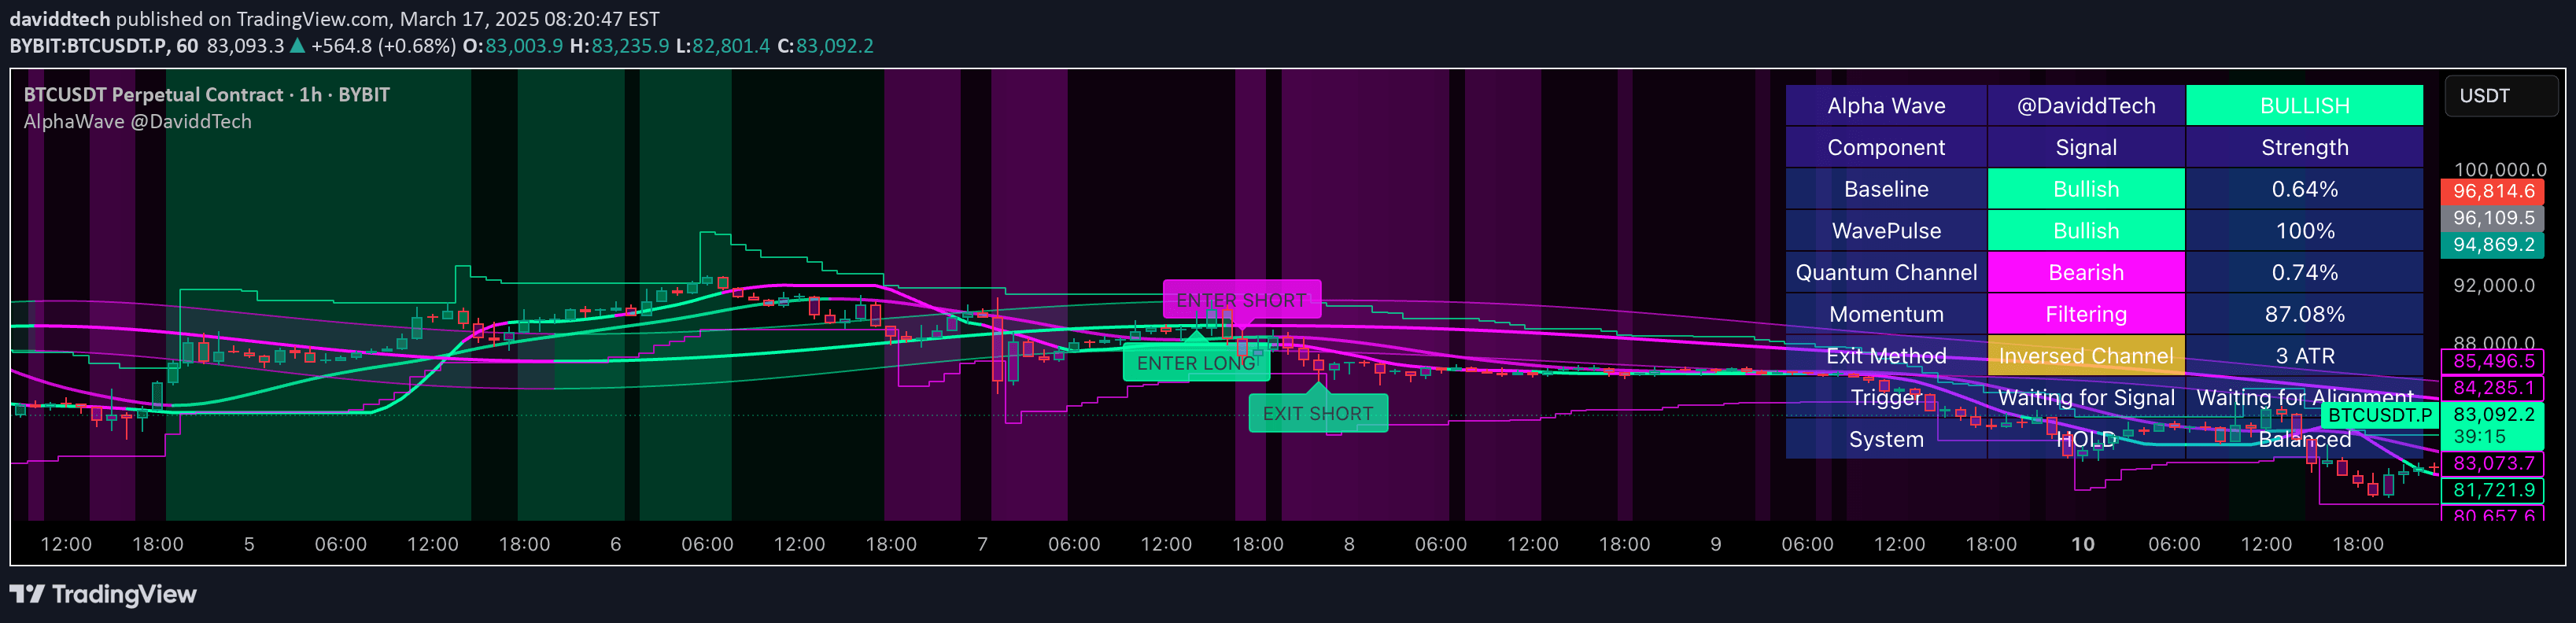
A dynamic momentum indicator using percentile analysis and ATR to detect significant market trends, providing clear long and short signals based on recent price action and volatility.
Explore complementary indicator rolesHow it works
The 75th-25th Percentile Momentum Indicator operates by calculating percentile ranks of price movements over a specified lookback period. It establishes upper and lower thresholds at the 75th and 25th percentiles, which dynamically adjust based on market volatility using Average True Range (ATR).
When price exceeds the 75th percentile adjusted by an ATR multiplier, a long signal is generated, indicating potential bullish momentum. Conversely, when price falls below the 25th percentile adjusted by an ATR multiplier, a short signal is triggered, suggesting bearish momentum. This approach allows for adaptive and responsive trend detection across different market conditions.
Why it may be useful
The indicator provides traders with a sophisticated method to identify momentum shifts by incorporating both percentile analysis and volatility measurements. By using ATR-based adjustments, it accounts for changing market dynamics, offering more reliable signals than traditional static indicators.
Its ability to adapt to different market conditions makes it valuable for traders seeking to capture trend movements with enhanced precision. The visual representation, including color-coded bars and trend lines, helps traders quickly interpret market signals and make informed trading decisions.
When to explore it
This indicator is most effective in markets with clear trending characteristics, such as stocks, forex, and futures with consistent directional movements. It performs exceptionally well during periods of moderate to high volatility, where price movements are more pronounced and directional.
Traders should consider using this indicator in conjunction with other technical analysis tools to confirm signals and reduce false positives. It is particularly useful for momentum traders, trend followers, and those looking to identify potential market reversals or significant price action events.
Keep exploring
What we’ve verified
Access, alerts and repainting behaviour have not been independently verified for this indicator. Check the creator’s current publication and settings.
General descriptions and classifications are recovered research. Verified details above identify the specific checks we have completed. Check the creator’s current publication for later changes.