
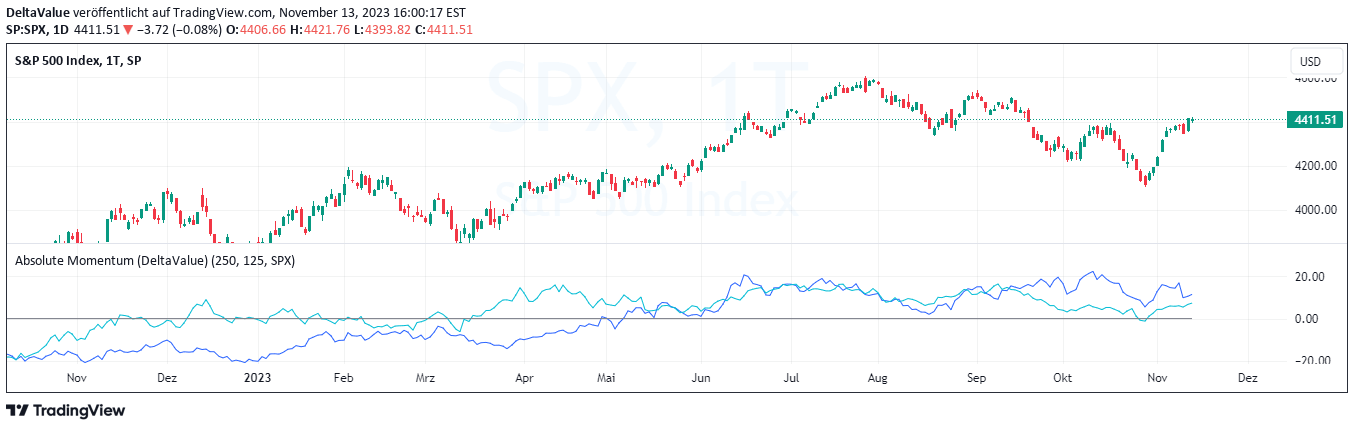
Absolute momentum analyzes an asset's historical performance over 12 months to determine its price trend, helping traders identify potential buying or selling opportunities based on past performance.
Explore complementary indicator rolesHow it works
Absolute momentum calculates an asset's performance over a standard 12-month look-back period by measuring its returns. The indicator plots this performance against a zero percent line, with crossings above indicating positive momentum and crossings below signaling negative momentum.
Traders can calculate absolute momentum by examining the asset's total return during the specified period, optionally subtracting the risk-free rate for more precise analysis. The strategy focuses on the asset's individual trend rather than comparing it to other assets, providing a straightforward method for assessing price movement.
Why it may be useful
Absolute momentum serves as a valuable timing instrument for individual assets and entire markets, offering insights into potential investment opportunities. It helps reduce downside volatility and mitigate behavioral biases by providing a systematic approach to trend analysis.
Academic research has demonstrated the effectiveness of absolute momentum across various asset classes, including stocks, bonds, commodities, and foreign exchange. By offering a simple yet robust method for evaluating an asset's performance, this strategy helps traders make more informed investment decisions.
When to explore it
Absolute momentum works best in multi-asset portfolios and long-only investing strategies, where traders seek to identify persistent trends across different market conditions. It is particularly useful for investors looking to capture momentum in assets that demonstrate consistent performance over medium-term periods.
The strategy is most effective when combined with other analytical tools, such as fundamental analysis and broader market trend evaluation. Traders should regularly reassess momentum, potentially on a monthly or quarterly basis, and use it as part of a comprehensive investment approach that includes diversification and risk management.
Keep exploring
What we’ve verified
Access, alerts and repainting behaviour have not been independently verified for this indicator. Check the creator’s current publication and settings.
General descriptions and classifications are recovered research. Verified details above identify the specific checks we have completed. Check the creator’s current publication for later changes.


