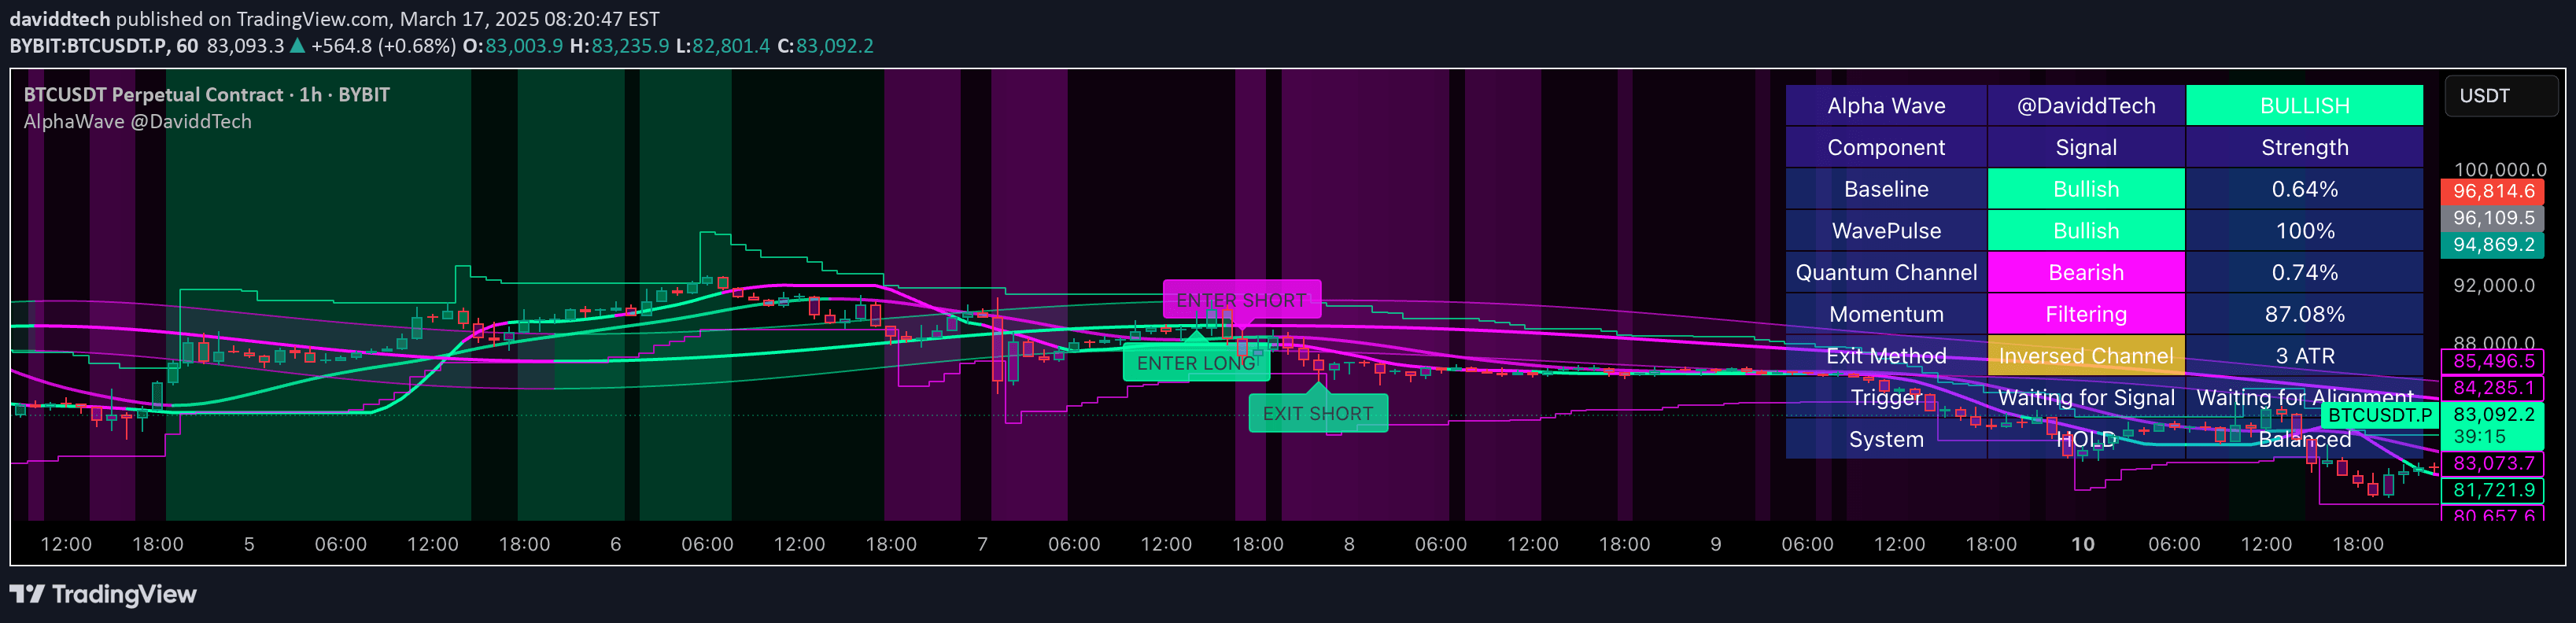
A 5-minute scalping strategy utilizing RSI, Bollinger Bands, and exponential moving averages to identify potential short trade opportunities based on market attrition and breakout signals.
Explore complementary indicator rolesHow it works
The trading signal combines multiple technical indicators to generate short trade opportunities in a 5-minute timeframe. It primarily uses RSI to identify overbought conditions and Bollinger Bands to detect price movements outside standard deviation channels.
Four exponential moving averages are employed to analyze price action and potential trend wear or breakout. An additional distance indicator helps traders visualize the proximity of closing prices to the 10-period exponential moving average, offering visual cues about market dynamics and potential trade entry points.
Why it may be useful
This unified indicator approach provides traders with a comprehensive view of market conditions by integrating multiple technical analysis tools. By combining RSI, Bollinger Bands, and moving averages, traders can make more informed decisions about potential short trade opportunities.
The strategy's strength lies in its ability to identify market attrition, breakouts, and retracements, helping traders pinpoint precise entry points. The flexible visualization options and customizable distance percentage allow traders to adapt the indicator to their specific trading preferences and risk management strategies.
When to explore it
The trading signal is most effective in volatile 5-minute timeframes where rapid price movements can be leveraged for short trades. It works best in markets with clear trending or volatile characteristics, where price movements are pronounced and directional.
Traders should use this strategy when seeking short-term trading opportunities, particularly in markets demonstrating overbought conditions or significant price deviations from standard moving average ranges. The indicator is particularly useful for traders who prefer a systematic approach to identifying potential trade entries based on multiple technical indicators.
Keep exploring
What we’ve verified
Access, alerts and repainting behaviour have not been independently verified for this indicator. Check the creator’s current publication and settings.
General descriptions and classifications are recovered research. Verified details above identify the specific checks we have completed. Check the creator’s current publication for later changes.