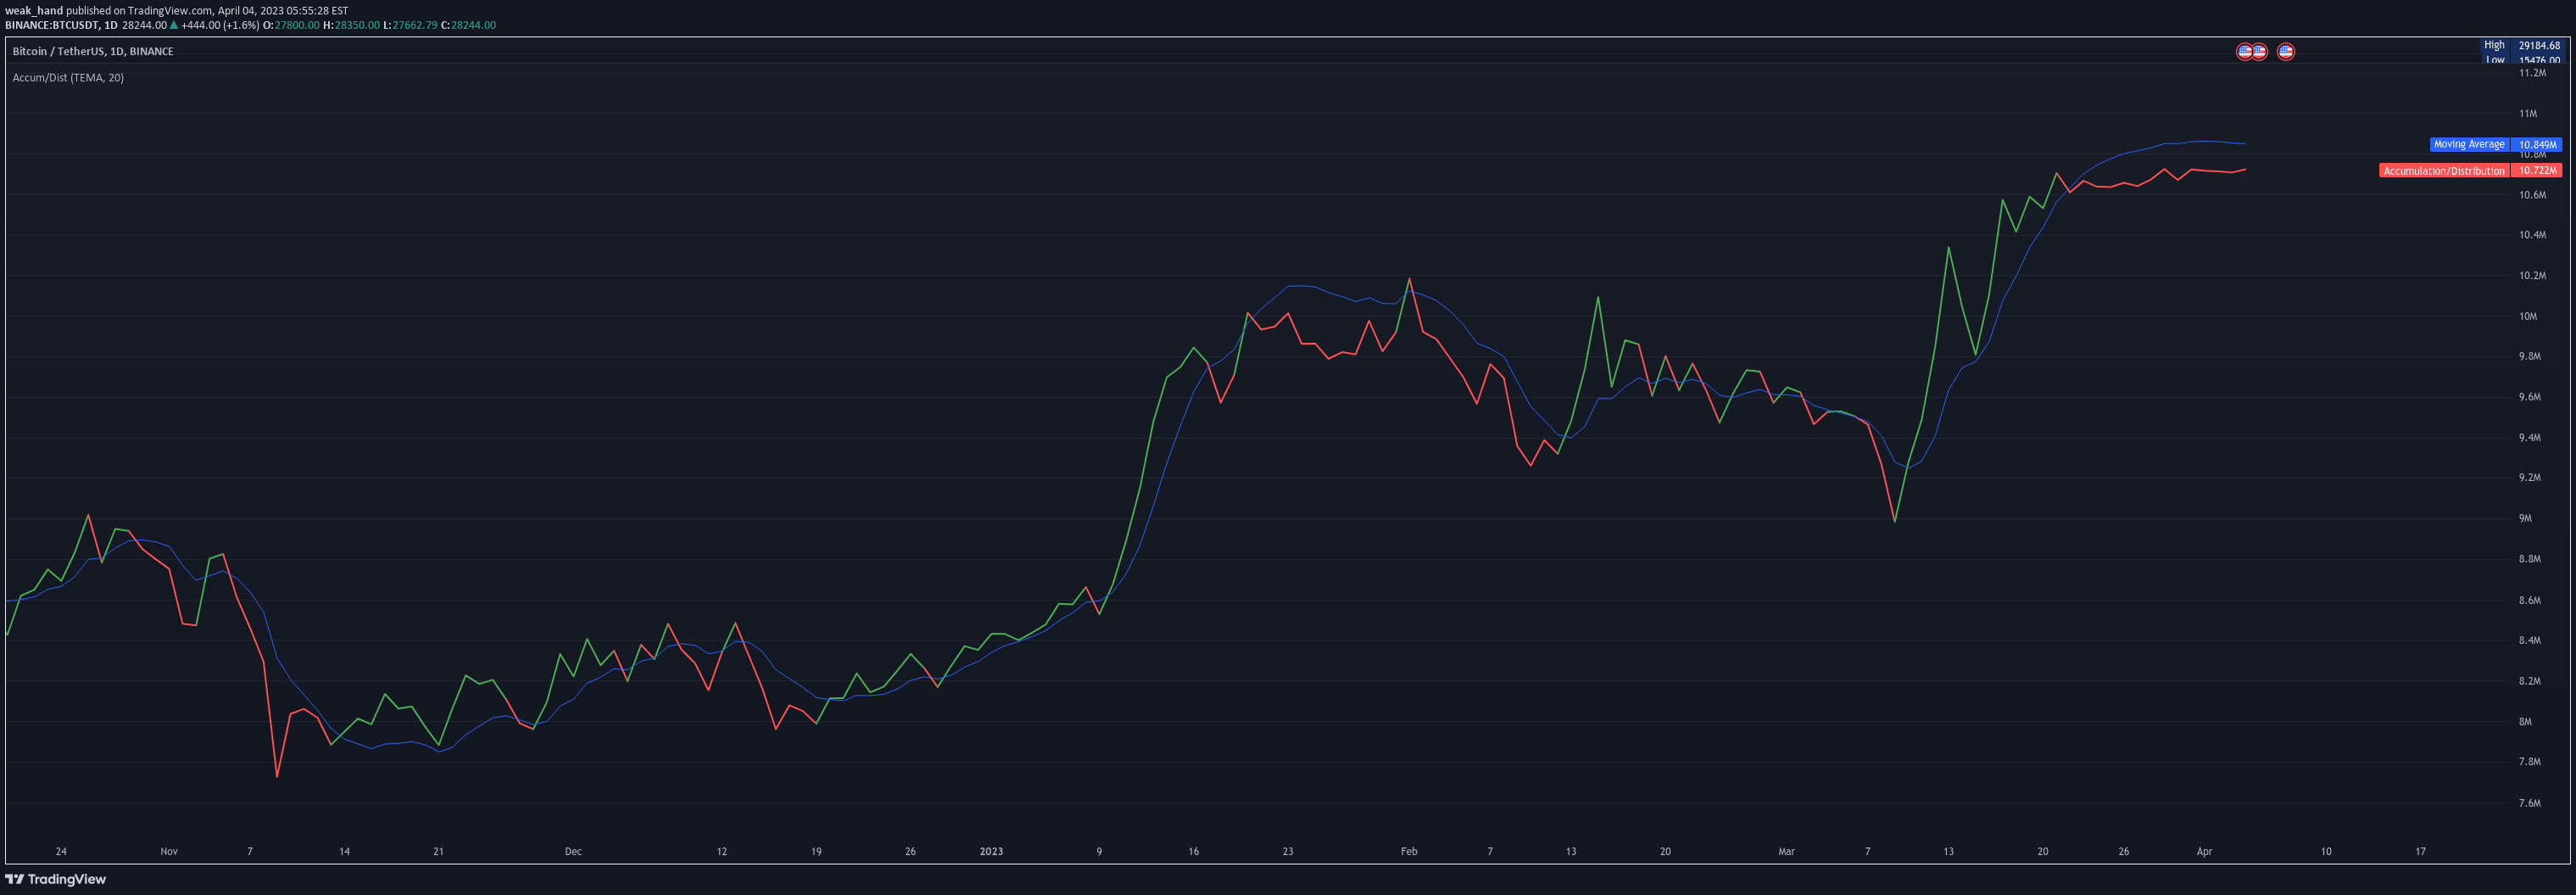
Accumulation/Distribution indicator tracks potential buying and selling activities by big market players, helping traders understand market sentiment through moving average interactions.
Explore complementary indicator rolesHow it works
Accumulation/Distribution (A/D) indicator analyzes the relationship between price movement and trading volume to determine potential buying or selling pressure by institutional investors. The indicator tracks whether large market participants are accumulating (buying) or distributing (selling) an asset by comparing price changes with volume.
The indicator uses a moving average (such as TEMA20) to provide additional context about market dynamics. When the moving average is positioned above the A/D line, it suggests a distribution phase where big players are selling, while a moving average below the A/D line indicates an accumulation phase where big players are buying.
Why it may be useful
The Accumulation/Distribution indicator provides traders with insights into potential market movements by revealing the actions of institutional investors. By understanding whether large market participants are buying or selling, traders can make more informed decisions about potential trend reversals or continuations.
This indicator is particularly valuable because it combines volume analysis with price movement, offering a more comprehensive view of market sentiment. Traders can use this information to anticipate potential market shifts and align their trading strategies with the actions of more influential market participants.
When to explore it
The Accumulation/Distribution indicator works best in markets with significant institutional participation, such as cryptocurrencies, stocks, and major forex pairs. It is most effective when used in conjunction with other technical indicators and volume analysis to confirm potential trading signals.
Traders should pay special attention to this indicator during periods of potential market transitions, such as when price trends are showing signs of weakening or strengthening. By combining the A/D indicator with other technical tools, traders can develop more robust trading strategies that account for both price action and volume dynamics.
Keep exploring
What we’ve verified
Access, alerts and repainting behaviour have not been independently verified for this indicator. Check the creator’s current publication and settings.
General descriptions and classifications are recovered research. Verified details above identify the specific checks we have completed. Check the creator’s current publication for later changes.