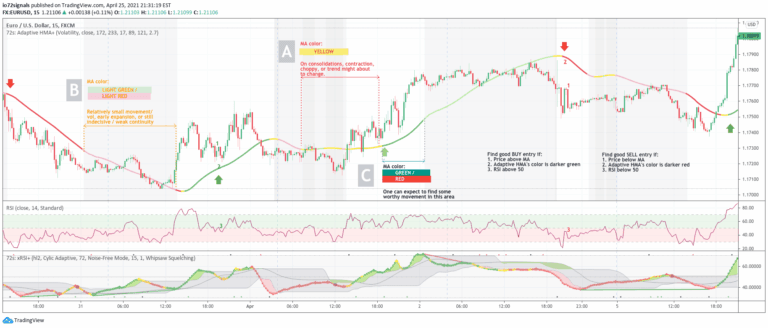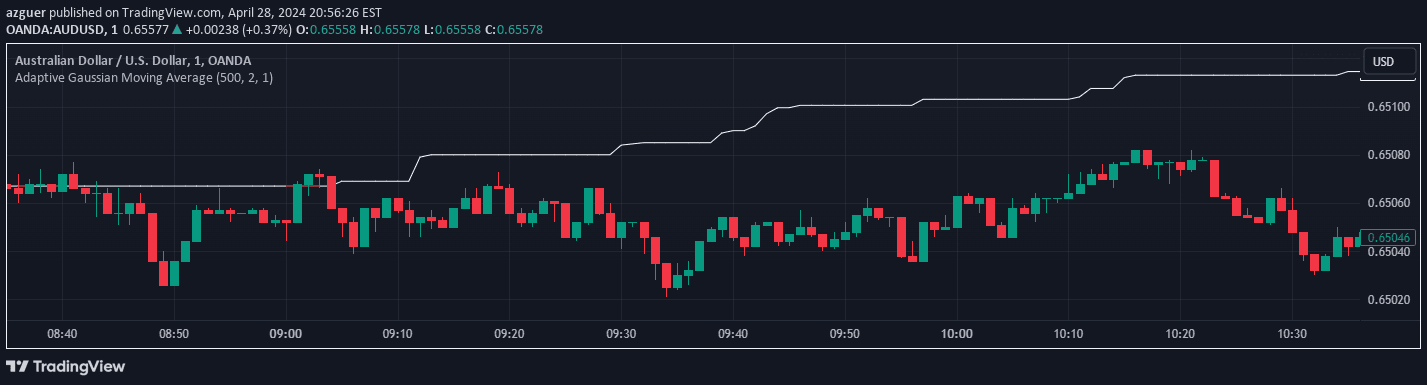
The Adaptive Gaussian Moving Average is a dynamic trend indicator that smooths price data using a Gaussian distribution and adjusts sensitivity based on market volatility.
Explore complementary indicator rolesHow it works
The Adaptive Gaussian Moving Average (AGMA) calculates a smoothed trend line using a weighted moving average based on a Gaussian distribution. It considers a specified number of price bars and dynamically adjusts its calculation using market volatility parameters.
When the adaptive feature is enabled, the indicator automatically calculates the standard deviation from closing prices over a volatility period. This allows the AGMA to become more responsive during high volatility and less sensitive during stable market conditions, providing a flexible and adaptive trend analysis tool.
Why it may be useful
The AGMA offers traders a sophisticated method of tracking market trends with enhanced adaptability compared to traditional moving averages. By incorporating volatility-based adjustments, it provides a more nuanced view of price movements that can help traders make more informed decisions.
Its ability to dynamically respond to changing market conditions makes it a valuable tool for identifying trend strength, potential reversals, and market momentum across different trading timeframes and asset classes.
When to explore it
The AGMA is most effective during markets with varying volatility levels, where traditional moving averages might lag or provide less accurate signals. Traders can use it to identify trend direction, confirm trend strength, and generate potential entry and exit points across different trading strategies.
It works particularly well when combined with other technical indicators, helping to validate trend signals and provide additional context for trading decisions in both trending and ranging market environments.
Keep exploring
What we’ve verified
Access, alerts and repainting behaviour have not been independently verified for this indicator. Check the creator’s current publication and settings.
General descriptions and classifications are recovered research. Verified details above identify the specific checks we have completed. Check the creator’s current publication for later changes.