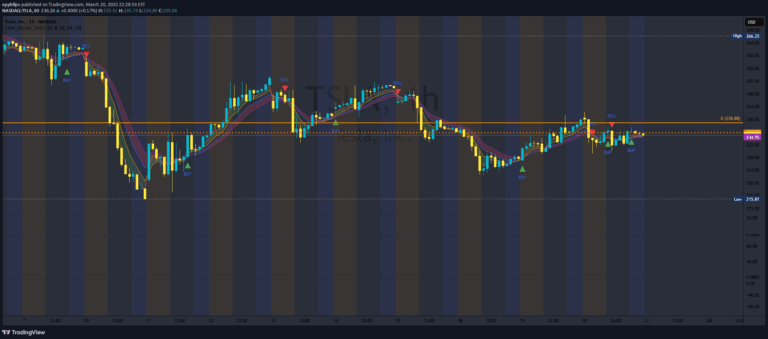
An advanced indicator combining two moving averages and Bollinger Bands to visualize price divergence and market trends through innovative histogram representations.
Explore complementary indicator rolesHow it works
The Adaptive MA-Bollinger Histogram calculates the distance between price and two different moving averages, creating unique histograms that display price relationships. These histograms are plotted inversely, with one moving average histogram showing positive values above the centerline and the other below, creating a visually distinctive representation of price movement.
Additionally, the indicator applies Bollinger Bands to each histogram, which helps highlight areas of market volatility and potential price transitions. By using different moving average types and customizable parameters, traders can adapt the indicator to various market conditions and trading styles.
Why it may be useful
This indicator provides traders with a sophisticated method of analyzing price trends and potential market reversals by simultaneously tracking multiple moving averages. Its unique visualization allows traders to quickly identify divergences between price and moving averages, offering insights that might be missed with traditional technical analysis tools.
The combination of moving averages and Bollinger Bands creates a comprehensive view of market dynamics, helping traders understand not just trend direction but also potential volatility and momentum shifts. By presenting complex data in an intuitive, visually engaging format, the indicator empowers traders to make more informed trading decisions.
When to explore it
The Adaptive MA-Bollinger Histogram works best in markets with clear trend movements and moderate to high volatility, such as forex, stocks, and cryptocurrency trading. Traders can leverage this indicator during periods of potential trend reversals, breakouts, and when seeking early signals of changing market momentum.
It is particularly useful for identifying divergence between price and moving averages, spotting potential overbought or oversold conditions, and recognizing periods of low volatility that might precede significant price movements. Traders should combine this indicator with other technical analysis tools and fundamental research to confirm signals and manage risk effectively.
Keep exploring
What we’ve verified
Access, alerts and repainting behaviour have not been independently verified for this indicator. Check the creator’s current publication and settings.
General descriptions and classifications are recovered research. Verified details above identify the specific checks we have completed. Check the creator’s current publication for later changes.