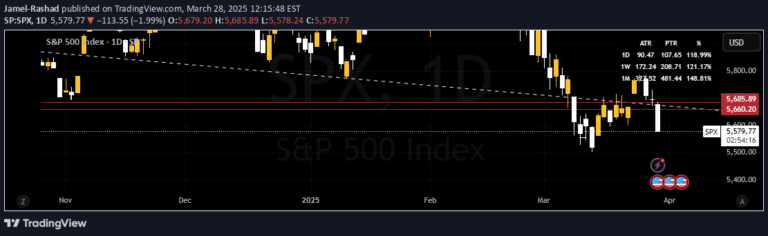
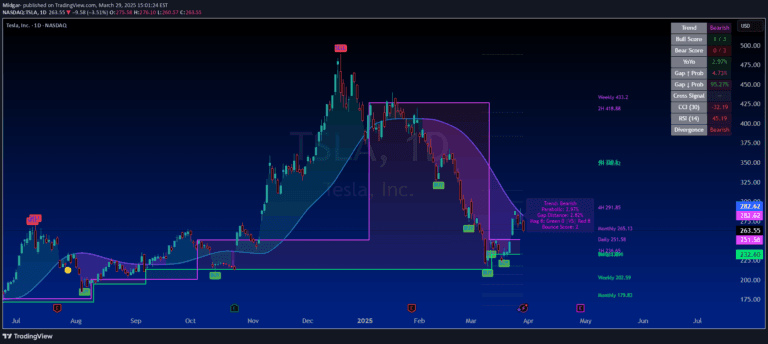
An advanced indicator combining Average True Range and Directional Movement Index to create refined directional lines that track price movement strength and direction.
Explore complementary indicator rolesHow it works
The indicator starts by calculating the True Range (TR), which measures price volatility by comparing current high-low range with previous close. It then computes Adjusted Directional Movement (ADM) by comparing current and previous price ranges, creating Plus ADM and Minus ADM values.
These ADM values are normalized by dividing them by the True Range, ensuring accurate representation of price movement proportions. The directional lines are then smoothed using a simple moving average, producing Plus Directional Line (+DI) and Minus Directional Line (-DI) that provide insights into price movement dynamics.
Why it may be useful
This indicator offers traders a sophisticated method of understanding price movement beyond traditional technical analysis tools. By integrating multiple calculation methods, it provides a more nuanced view of market trends, helping traders identify potential trend strengths and directional shifts with greater precision.
The normalized and smoothed directional lines allow traders to quickly assess market momentum and make more informed trading decisions. Its ability to capture subtle price movement variations makes it a valuable tool for traders seeking comprehensive market analysis.
When to explore it
The indicator is most effective in markets with clear trending characteristics, where price movements show consistent directional momentum. It works exceptionally well in volatile markets where traditional trend indicators might provide less reliable signals.
Traders can leverage this tool across various timeframes, from short-term scalping to longer-term swing trading. It is particularly useful when combined with other technical indicators to confirm trend strength and potential entry or exit points in trading strategies.
Keep exploring
What we’ve verified
Access, alerts and repainting behaviour have not been independently verified for this indicator. Check the creator’s current publication and settings.
General descriptions and classifications are recovered research. Verified details above identify the specific checks we have completed. Check the creator’s current publication for later changes.