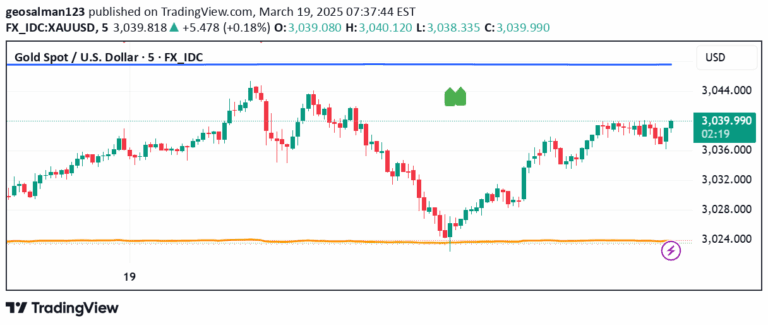
A multi-timeframe trend analysis tool that combines moving averages and RSI to determine market direction across different timeframes for comprehensive trading insights.
Explore complementary indicator rolesHow it works
The script uses moving averages and RSI to evaluate market trends across multiple timeframes. It calculates trend direction by comparing current and previous closing prices while simultaneously analyzing the RSI value.
A custom trendDirection function classifies market movements as 'Up', 'Down', or 'Sideways' based on specific price and RSI conditions. The analysis is performed across different timeframes including 5m, 15m, 60m, 240m, and Daily, providing a comprehensive view of market dynamics.
Why it may be useful
This multi-timeframe trend analysis helps traders gain a more nuanced understanding of market movements by examining trends across different time horizons. By combining moving averages and RSI, traders can identify potential trend strength, momentum, and potential reversals more effectively.
The comprehensive approach reduces the risk of making trading decisions based on limited timeframe perspectives, offering a more holistic view of market behavior and potential trading opportunities.
When to explore it
This trend analysis tool is most effective during periods of clear market trends and when traders want to confirm trend strength across multiple timeframes. It works best in markets with sufficient liquidity and consistent price movements.
Traders should use this tool when seeking to validate trend direction, identify potential entry and exit points, and understand the broader market context across different time horizons.
Keep exploring
What we’ve verified
Access, alerts and repainting behaviour have not been independently verified for this indicator. Check the creator’s current publication and settings.
General descriptions and classifications are recovered research. Verified details above identify the specific checks we have completed. Check the creator’s current publication for later changes.