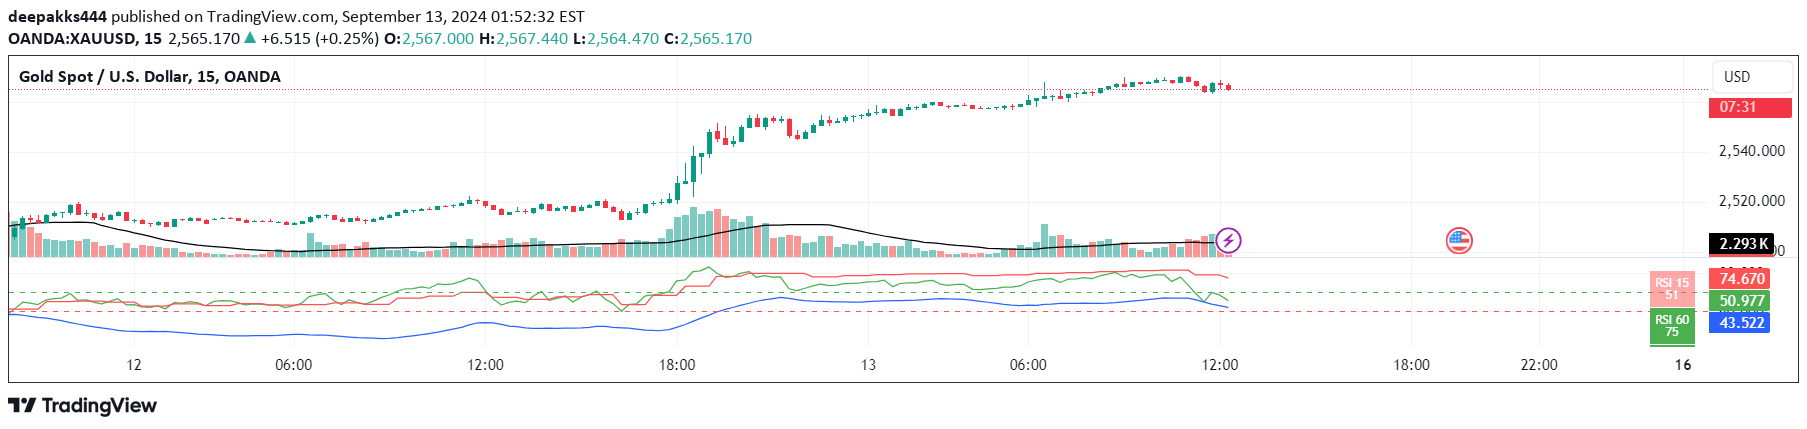
Advanced RSI indicator with custom momentum analysis and EMA trend tracking, providing comprehensive market insights through separate pane visualization and optional divergence detection.
Explore complementary indicator rolesHow it works
The indicator calculates a custom RSI using adjustable parameters, creating a separate pane for momentum analysis with optional moving average overlay. It plots three exponential moving averages (EMAs) on the main price chart, typically using 20, 50, and 200-period lengths to establish trend structure.
The RSI component includes an overbought/oversold gradient with 70/30 zones and a neutral 50 midline. An optional divergence detection system identifies potential trend reversals by comparing price action with RSI movement, marking regular bullish and bearish divergences with visual alerts and customizable lookback periods.
Why it may be useful
This indicator provides traders with a comprehensive view of market momentum and trend dynamics without cluttering the main price chart. By combining RSI analysis with EMA trend indicators, it offers a multi-dimensional approach to market assessment that helps traders confirm potential entry and exit points.
The flexible design allows customization for different trading styles, from scalping to swing trading, making it a versatile tool for traders seeking deeper market insights. Its ability to detect momentum shifts and trend structures can help traders make more informed decisions by providing context beyond simple price action.
When to explore it
The indicator is most effective on timeframes of 15 minutes and higher, making it particularly suitable for day and swing trading strategies. It performs best when used to analyze market momentum, confirm trend strength, and identify potential reversal points across various financial instruments.
Traders should use this tool in conjunction with other technical analysis methods, paying special attention to the RSI divergence signals and EMA crossovers. It is particularly valuable for traders who want a comprehensive view of market dynamics without relying on a single indicator for trading decisions.
Keep exploring
What we’ve verified
Access, alerts and repainting behaviour have not been independently verified for this indicator. Check the creator’s current publication and settings.
General descriptions and classifications are recovered research. Verified details above identify the specific checks we have completed. Check the creator’s current publication for later changes.