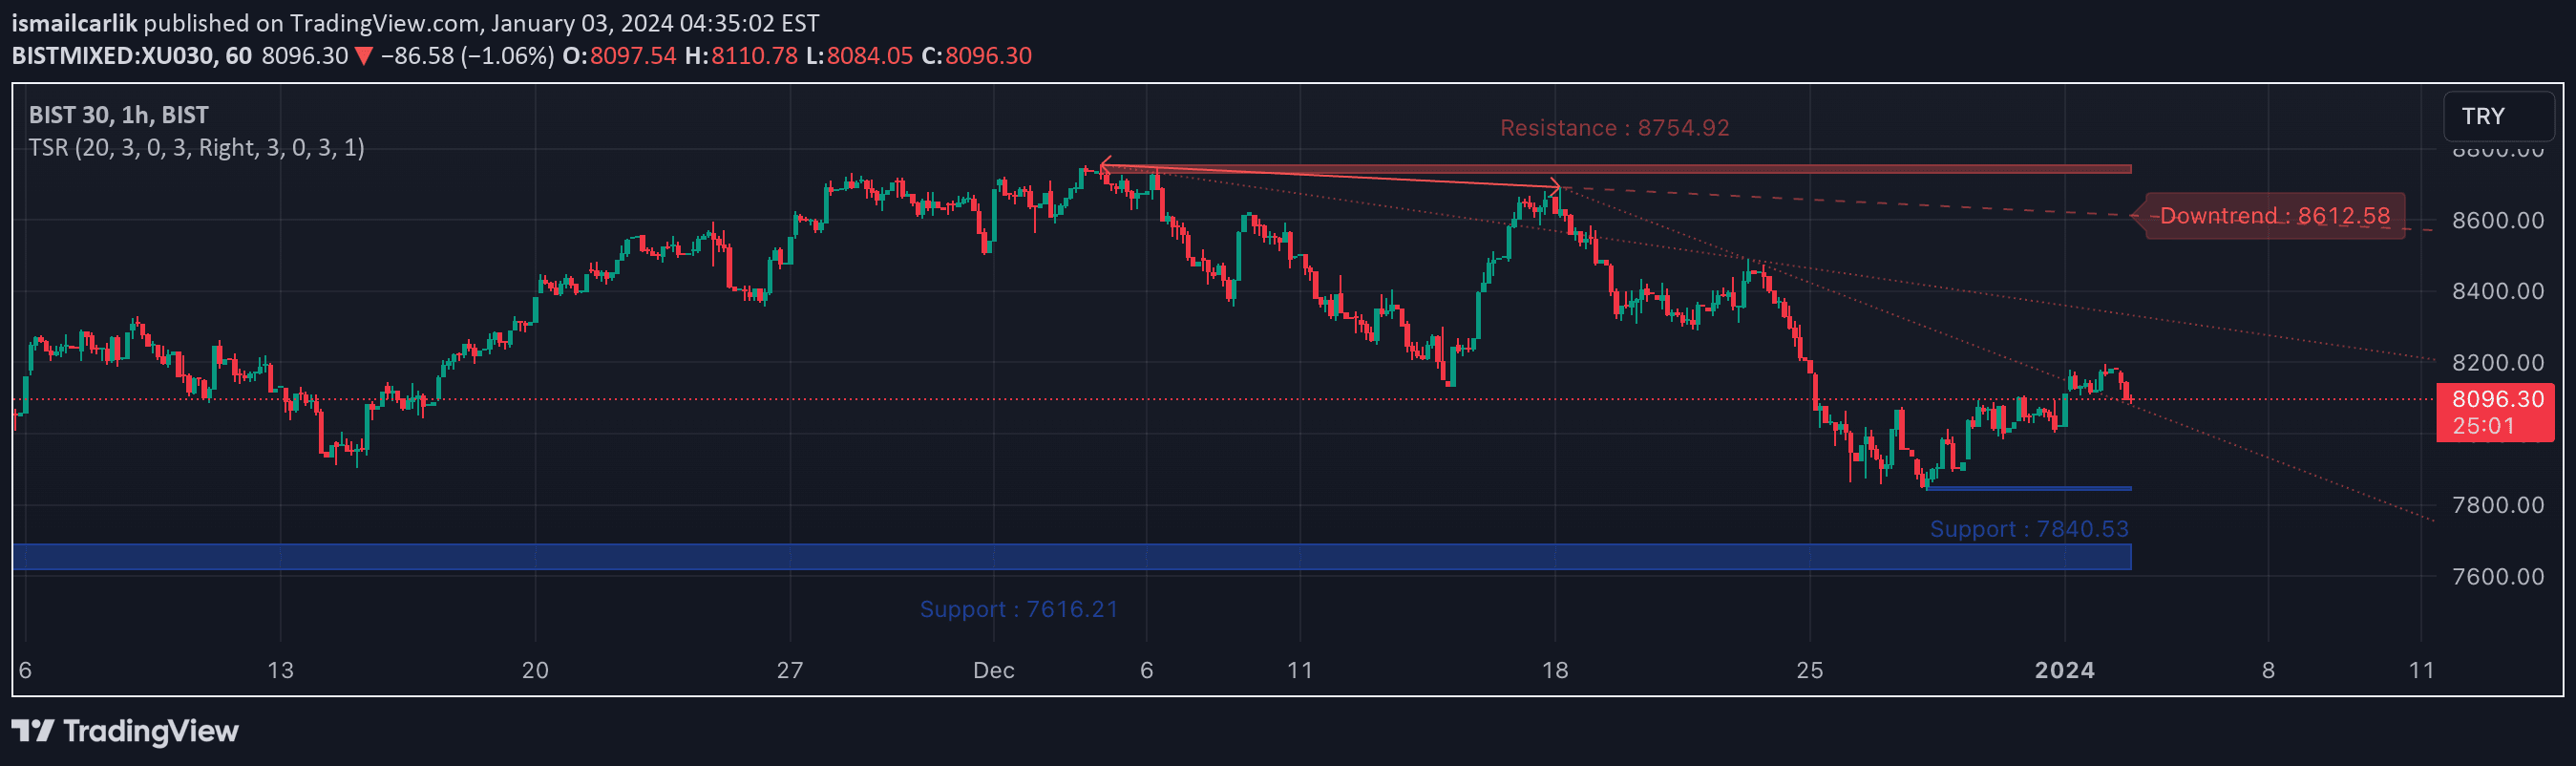
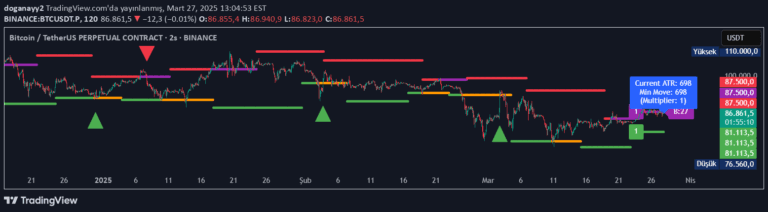
An innovative indicator that draws continuous lines connecting market tops and bottoms, providing a clear visual representation of price trends and potential reversals directly on the price chart.
Explore complementary indicator rolesHow it works
The Alboncalc Top and Bottom Detector identifies market tops and bottoms by analyzing price action over a user-defined period. It looks for the highest high and lowest low within a specified number of candles, marking these points as potential trend reversal zones. When a top or bottom is detected, the indicator draws a continuous line connecting these significant price points.
As the price continues in the same trend, the line remains straight and extends, providing a clear visual representation of market movement. If a trend reversal occurs, the indicator automatically creates a new line connecting the previous top or bottom to the new reversal point, allowing traders to quickly identify changes in market direction.
Why it may be useful
Traditional indicators often rely on complex mathematical formulas or abstract representations that can be difficult to interpret quickly. This indicator simplifies trend analysis by providing a direct, visual method of tracking price movements, making it easier for traders to understand market dynamics at a glance. Its unique approach of drawing continuous lines helps traders immediately recognize trend continuations and potential reversals.
By focusing on price action and creating a clear, intuitive visual representation, the indicator reduces the cognitive load typically associated with technical analysis. Traders can more easily spot trend changes, make more informed decisions, and potentially improve their trading strategy by having a more straightforward view of market movements.
When to explore it
The Alboncalc Top and Bottom Detector is most effective in markets with clear trending behavior, such as stocks, forex, and cryptocurrencies. It works particularly well in timeframes that allow for more defined price swings, such as daily, 4-hour, and 1-hour charts. Traders can adjust the top and bottom periods to match their specific trading style and the characteristics of the financial instrument they are analyzing.
This indicator is especially useful for traders who prefer visual price action analysis and want a simple, straightforward method of identifying trend continuations and reversals. It can be particularly valuable for trend-following strategies, breakout trading, and for traders who want to quickly assess the overall market direction without relying on multiple complex indicators.
Keep exploring
What we’ve verified
Access, alerts and repainting behaviour have not been independently verified for this indicator. Check the creator’s current publication and settings.
General descriptions and classifications are recovered research. Verified details above identify the specific checks we have completed. Check the creator’s current publication for later changes.