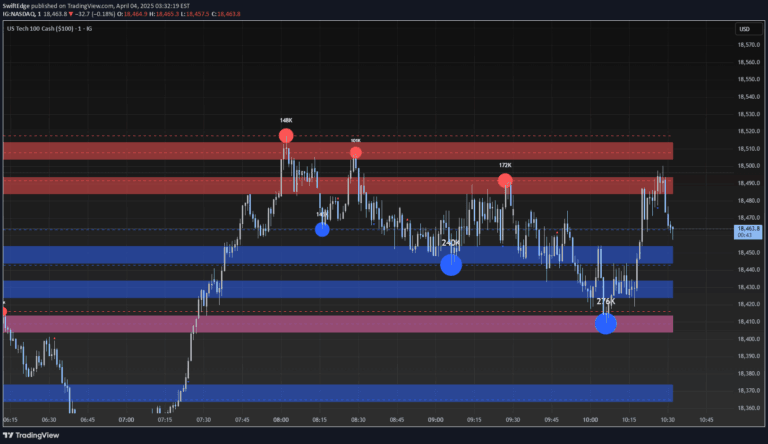
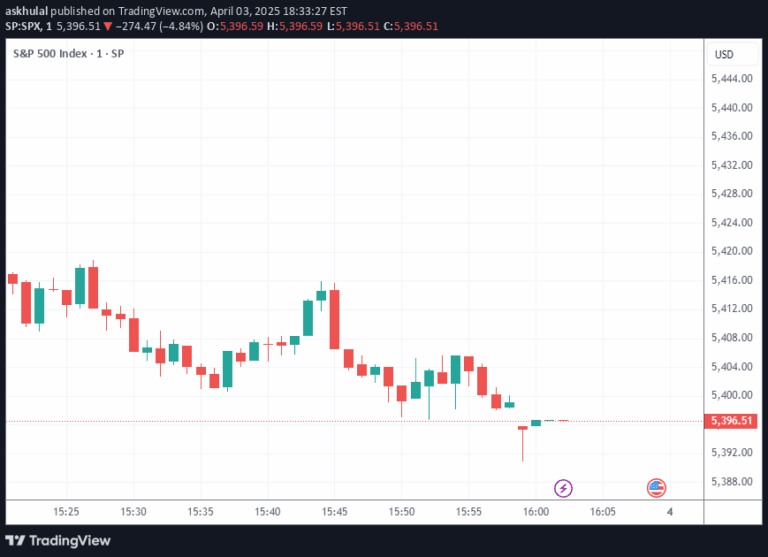
A TradingView indicator for plotting and labeling predetermined price levels across NQ and ES futures, allowing traders to quickly visualize key market reference points.
Explore complementary indicator rolesHow it works
The Algoflow's Levels Plotter allows traders to input and visualize critical price levels for NQ and ES futures simultaneously. Users can enter predetermined levels for inflection points, bull and bear targets, and specify separate lines for Weekly, Overnight (OVN), and Regular Trading Hours (RTH) sessions.
The indicator processes these inputs and plots corresponding lines and labels on the chart, with configurable colors and placement options. Traders can customize the label orientation, spacing, and visibility, making it easy to track and reference important price levels across different market sessions.
Why it may be useful
Price levels are crucial for understanding market structure and potential trading opportunities. By providing a clear, visual representation of key price points, this indicator helps traders quickly identify potential support, resistance, and inflection zones without manual drawing or complex calculations.
The flexibility to plot levels for multiple futures contracts and sessions enables traders to maintain a comprehensive view of market dynamics. Customizable color coding and label placement further enhance the tool's utility, allowing traders to personalize their chart analysis and improve decision-making precision.
When to explore it
This indicator is most effective for traders who rely on specific price levels for their trading strategy, particularly in futures markets like NQ and ES. It is particularly useful for day traders and scalpers who need to quickly identify and track important market reference points during active trading sessions.
Traders can benefit from this tool when preparing for the trading day, conducting pre-market analysis, or monitoring intraday price action. It is especially valuable for those who use technical analysis based on predetermined levels, pivot points, and session-specific price targets.
Keep exploring
What we’ve verified
Access, alerts and repainting behaviour have not been independently verified for this indicator. Check the creator’s current publication and settings.
General descriptions and classifications are recovered research. Verified details above identify the specific checks we have completed. Check the creator’s current publication for later changes.