
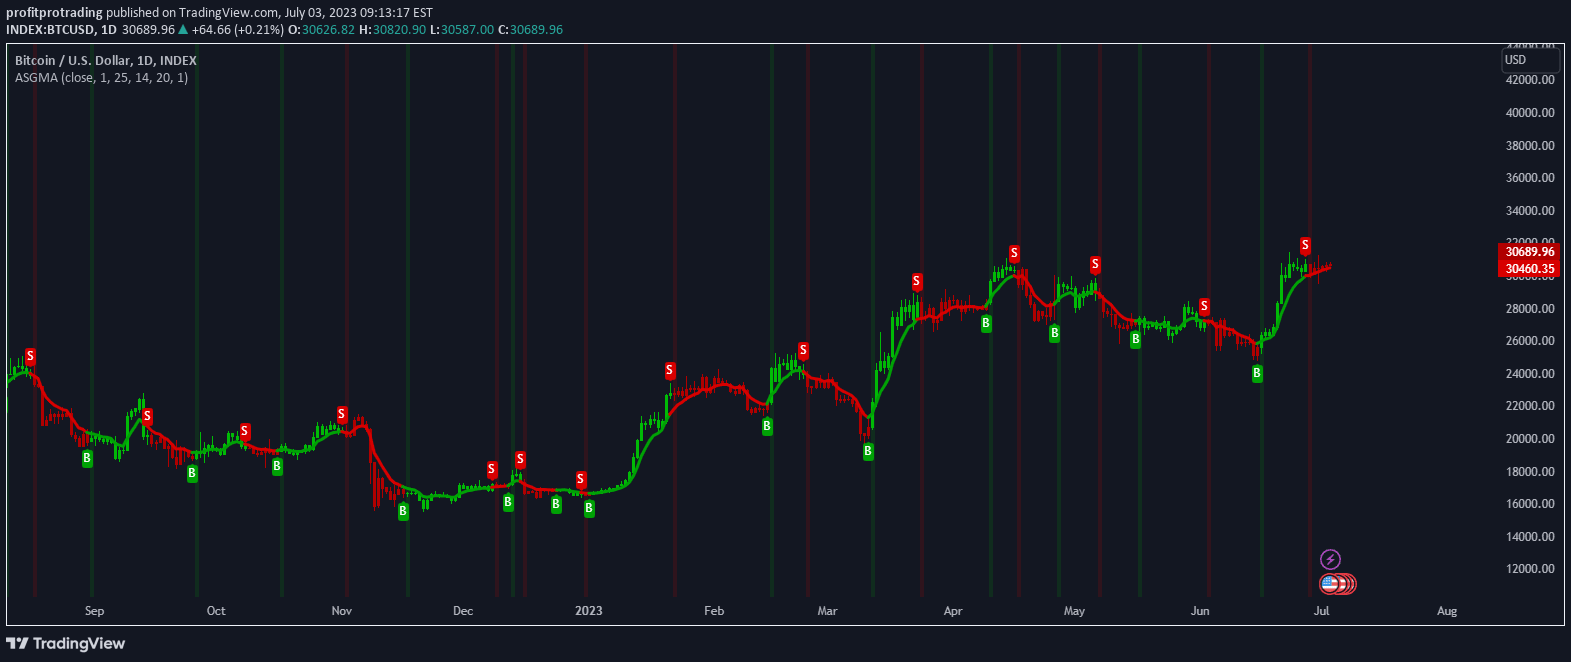
A hybrid moving average that combines Gaussian and ALMA smoothing techniques with RSI and CMO to generate advanced trend and momentum signals for traders.
Explore complementary indicator rolesHow it works
The ASGMA applies specialized smoothing techniques to price data, utilizing Gaussian Moving Average principles and Arnaud Legoux Moving Average (ALMA) calculations. It dynamically adjusts weights to capture both high and low-frequency market components, creating a responsive trend-following indicator that minimizes lag.
By integrating RSI and Chande Momentum Oscillator (CMO), the ASGMA generates comprehensive trend signals. When all three indicators align, the system produces vertical colored lines indicating strong buy or sell conditions, with the Exponential Moving Average (EMA) line changing colors to reflect bullish or bearish momentum.
Why it may be useful
The ASGMA provides traders with a sophisticated analytical tool that combines multiple technical analysis techniques into a single, powerful indicator. By blending different smoothing and momentum methodologies, it offers more nuanced insights into market trends than traditional single-method indicators.
This approach allows traders to obtain a more comprehensive view of market dynamics, potentially improving decision-making precision. The integrated signals help identify trend strength, momentum shifts, and potential entry and exit points across various trading timeframes.
When to explore it
The ASGMA is most effective in markets with clear trending characteristics, where price movements demonstrate consistent directional momentum. It performs optimally in liquid markets with sufficient price volatility, such as major currency pairs, stock indices, and prominent commodities.
Traders should utilize this indicator during periods of stable market conditions and avoid using it during extreme market volatility or during major economic announcements. It is particularly useful for traders seeking a comprehensive, multi-dimensional approach to trend analysis and momentum assessment.
Keep exploring
What we’ve verified
Access, alerts and repainting behaviour have not been independently verified for this indicator. Check the creator’s current publication and settings.
General descriptions and classifications are recovered research. Verified details above identify the specific checks we have completed. Check the creator’s current publication for later changes.


