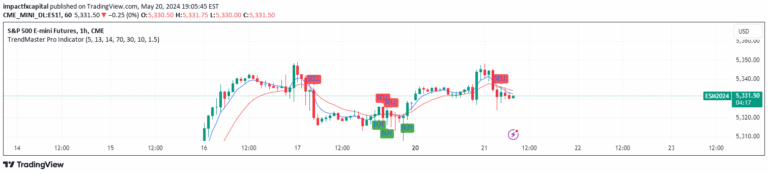
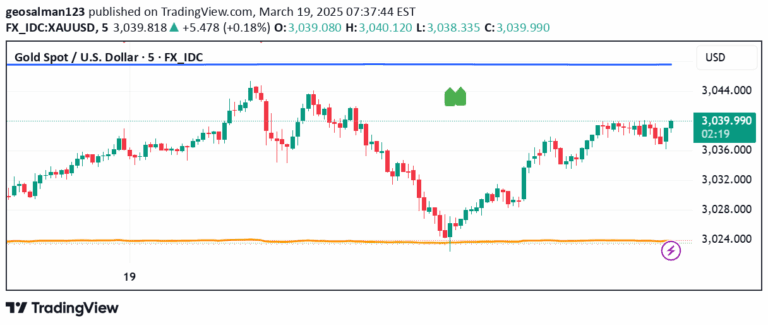
A comprehensive trading toolkit analyzing securities through daily metrics, historic performances, and technical indicators to provide holistic market insights and potential trading opportunities.
Explore complementary indicator rolesHow it works
The trading signal toolkit operates by systematically investigating market behavior through multiple analytical lenses. It begins with a forensic-like examination of historical price ranges, performance metrics, and trading volumes to establish a comprehensive understanding of the security's past movements.
Subsequently, the toolkit employs technical indicators like RSI and MACD across multiple timeframes to assess current market conditions and potential future trajectories. By integrating daily metrics, moving averages, and comparative analyses, traders can develop a nuanced perspective on the underlying asset's potential directional momentum.
Why it may be useful
This trading signal provides traders with a multi-dimensional view of market dynamics, transcending simplistic single-indicator approaches. By combining historical analysis, current performance metrics, and predictive technical indicators, traders gain a more robust framework for understanding potential market movements.
The toolkit's flexibility allows customization and adaptability, enabling traders to modify parameters, toggle visibility of different components, and create personalized analytical environments. This approach empowers traders to make more informed decisions by presenting a holistic, data-driven perspective on market behavior.
When to explore it
The trading signal toolkit is most effective during periods of market uncertainty or when seeking comprehensive market analysis across different timeframes. It proves particularly valuable when traders need a detailed, nuanced understanding of a security's performance beyond surface-level indicators.
Traders should leverage this toolkit during volatile market conditions, when transitional market states are anticipated, or when preparing for potentially significant market events. Its strength lies in providing a panoramic view of market dynamics, making it suitable for traders seeking a thorough, methodical approach to market analysis.
Keep exploring
What we’ve verified
Access, alerts and repainting behaviour have not been independently verified for this indicator. Check the creator’s current publication and settings.
General descriptions and classifications are recovered research. Verified details above identify the specific checks we have completed. Check the creator’s current publication for later changes.