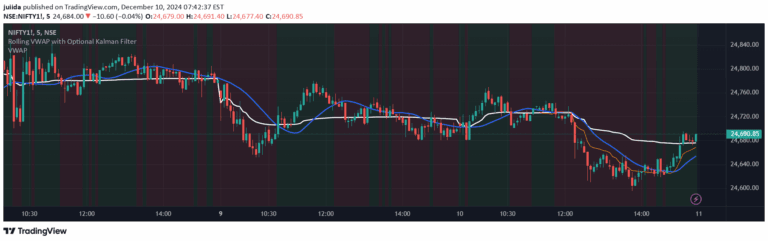
A sophisticated price visualization tool offering multiple charting modes that help traders interpret market data through innovative visual representations and advanced customization features.
Explore complementary indicator rolesHow it works
The Alternative Price [OmegaTools] script functions by transforming price data into multiple visualization modes including Candles, Line, Channel, Renko, and Bubbles. Each mode processes price information differently, using techniques like smoothing opens/closes, calculating ATR-based blocks, and representing volume through visual elements.
The script dynamically calculates price representations using advanced mathematical techniques such as averaging previous bar data, exponential moving averages, and volume-based gradients. It automatically detects and highlights engulfing patterns, providing traders with additional insights into potential market reversals and trend changes.
Why it may be useful
This indicator matters because it offers traders a comprehensive and flexible approach to analyzing price movements beyond traditional charting methods. By providing multiple visualization modes, traders can gain deeper insights into market behavior, detect nuanced trends, and understand price dynamics more intuitively.
The script's ability to customize colors, detect patterns, and represent volume graphically empowers traders to make more informed decisions. Its versatility allows adaptation to different trading styles and market conditions, making complex price data more accessible and actionable.
When to explore it
The Alternative Price [OmegaTools] is most effective when traders need a comprehensive view of market dynamics across different timeframes and trading styles. It works particularly well in markets with complex price movements, where traditional charting methods might obscure important trends or patterns.
Traders should utilize this tool when seeking to understand market trends, assess volume relationships, and identify potential reversal points. Its multiple modes make it suitable for various market conditions, from trending to ranging markets, providing flexibility in technical analysis approaches.
Keep exploring
What we’ve verified
Access, alerts and repainting behaviour have not been independently verified for this indicator. Check the creator’s current publication and settings.
General descriptions and classifications are recovered research. Verified details above identify the specific checks we have completed. Check the creator’s current publication for later changes.