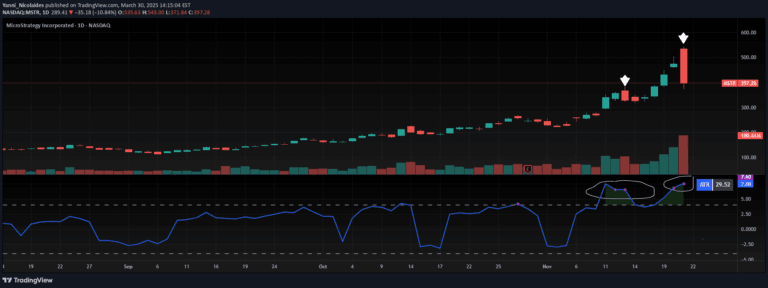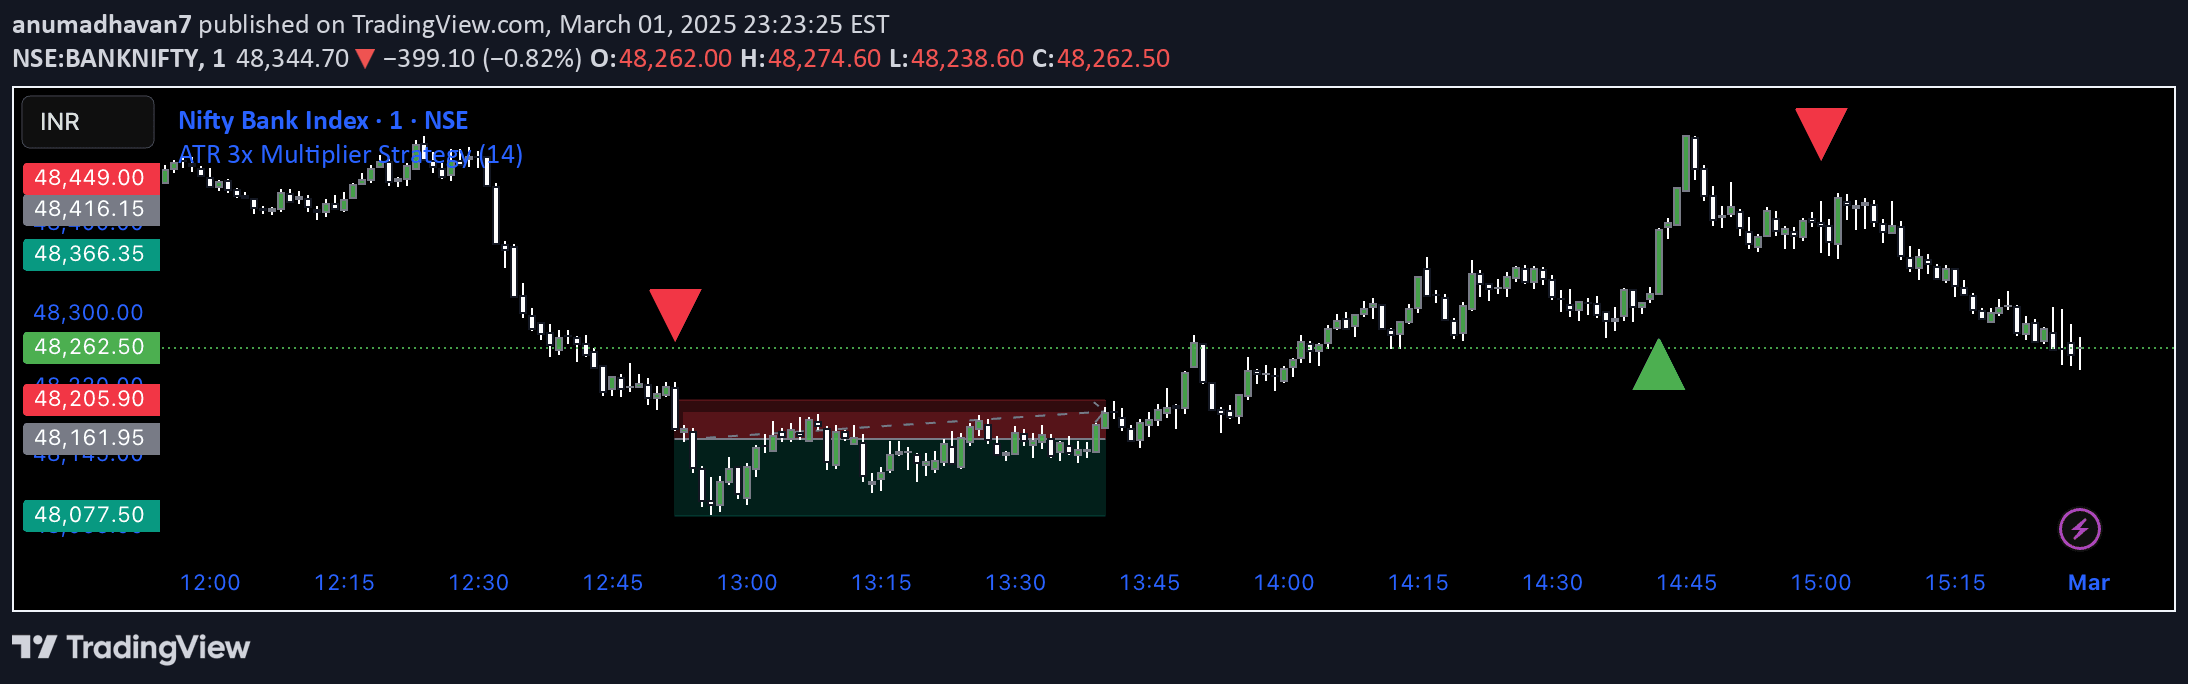
Volatility and candle spikes reveal market dynamics through price fluctuations and sudden movements, helping traders understand market sentiment and potential trading opportunities.
Explore complementary indicator rolesHow it works
Volatility measures price variation using indicators like Average True Range (ATR) and Bollinger Bands, tracking how much a financial asset's price fluctuates over time. These indicators help quantify market uncertainty by showing the magnitude of price movements.
Candle spikes represent sudden price movements that create long wicks on candlestick charts, revealing moments of strong buying or selling pressure. Traders analyze these spikes to understand market dynamics, including potential stop-loss triggers, liquidity hunts, and rapid sentiment shifts.
Why it may be useful
Understanding volatility helps traders assess market risk and potential profit opportunities by revealing the degree of price uncertainty and market dynamics. By monitoring volatility, traders can adapt their strategies to different market conditions and anticipate potential price movements.
Candle spikes provide critical insights into market sentiment, showing moments of rejection, potential trend reversals, and hidden market intentions. These visual cues help traders make more informed decisions about entry and exit points, risk management, and market psychology.
When to explore it
Volatility analysis works best during periods of significant market events, economic news releases, and high-liquidity trading sessions where price movements are more pronounced and meaningful. Traders should pay close attention to volatility indicators during earnings reports, central bank announcements, and geopolitical events.
Candle spikes are most useful when confirming trend reversals, identifying potential breakout points, and understanding market sentiment during key trading moments. Traders should carefully examine these spikes in conjunction with other technical indicators to validate potential trading opportunities and minimize false signals.
Keep exploring
What we’ve verified
Access, alerts and repainting behaviour have not been independently verified for this indicator. Check the creator’s current publication and settings.
General descriptions and classifications are recovered research. Verified details above identify the specific checks we have completed. Check the creator’s current publication for later changes.