
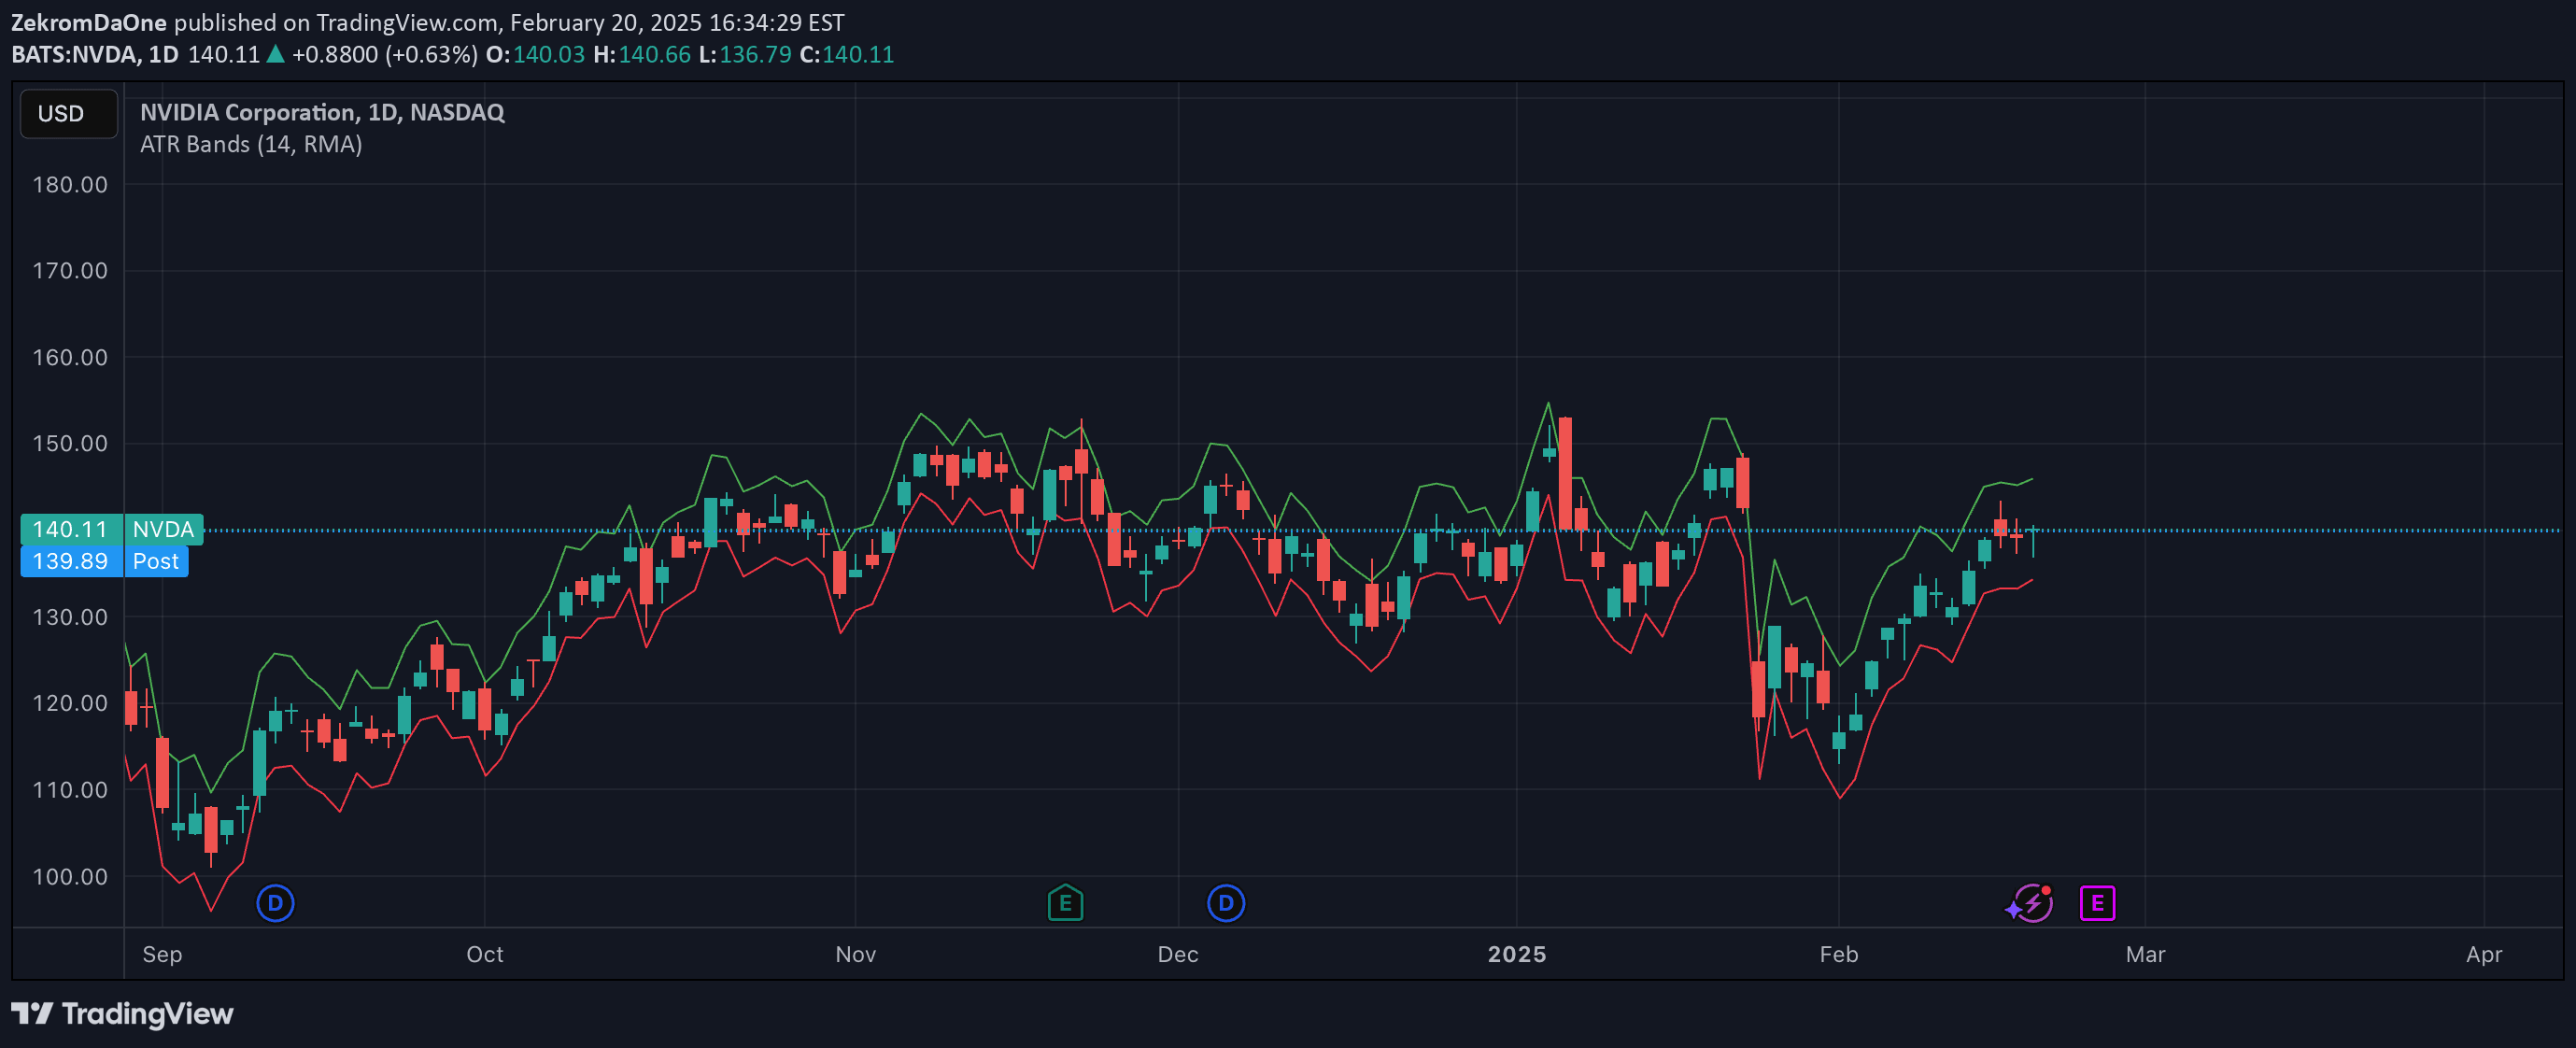
ATR Bands dynamically measure market volatility by creating upper and lower bands around price using Average True Range, helping traders identify potential breakouts and market conditions.
Explore complementary indicator rolesHow it works
The ATR Bands indicator calculates dynamic support and resistance levels by adding and subtracting the Average True Range (ATR) from the current price. The upper band represents the price plus ATR, while the lower band represents the price minus ATR, creating a volatility-based envelope around the current market price.
These bands automatically expand during periods of high volatility and contract during low volatility periods. Traders can customize the ATR calculation using different moving average methods like RMA, SMA, EMA, and WMA, allowing flexibility in analyzing market price movements and volatility.
Why it may be useful
ATR Bands provide traders with a dynamic and responsive tool for understanding market volatility and potential price movements. By visualizing price fluctuations through adaptive bands, traders can quickly assess market conditions and make more informed trading decisions based on real-time volatility changes.
The indicator offers insights into market momentum and potential trend reversals by showing how price interacts with these volatility-based boundaries. This helps traders identify potential entry and exit points, manage risk, and develop more sophisticated trading strategies that account for changing market dynamics.
When to explore it
ATR Bands are most effective in markets with significant price movements and changing volatility conditions. Traders can use these bands to identify potential breakout scenarios, assess trend strength, and determine periods of market consolidation or increased trading activity.
The indicator works particularly well in trending markets where price consistently touches or exceeds the upper or lower bands. It is especially useful for traders seeking to incorporate volatility-based strategies across different timeframes, from short-term scalping to longer-term swing trading approaches.
Keep exploring
What we’ve verified
Access, alerts and repainting behaviour have not been independently verified for this indicator. Check the creator’s current publication and settings.
General descriptions and classifications are recovered research. Verified details above identify the specific checks we have completed. Check the creator’s current publication for later changes.




