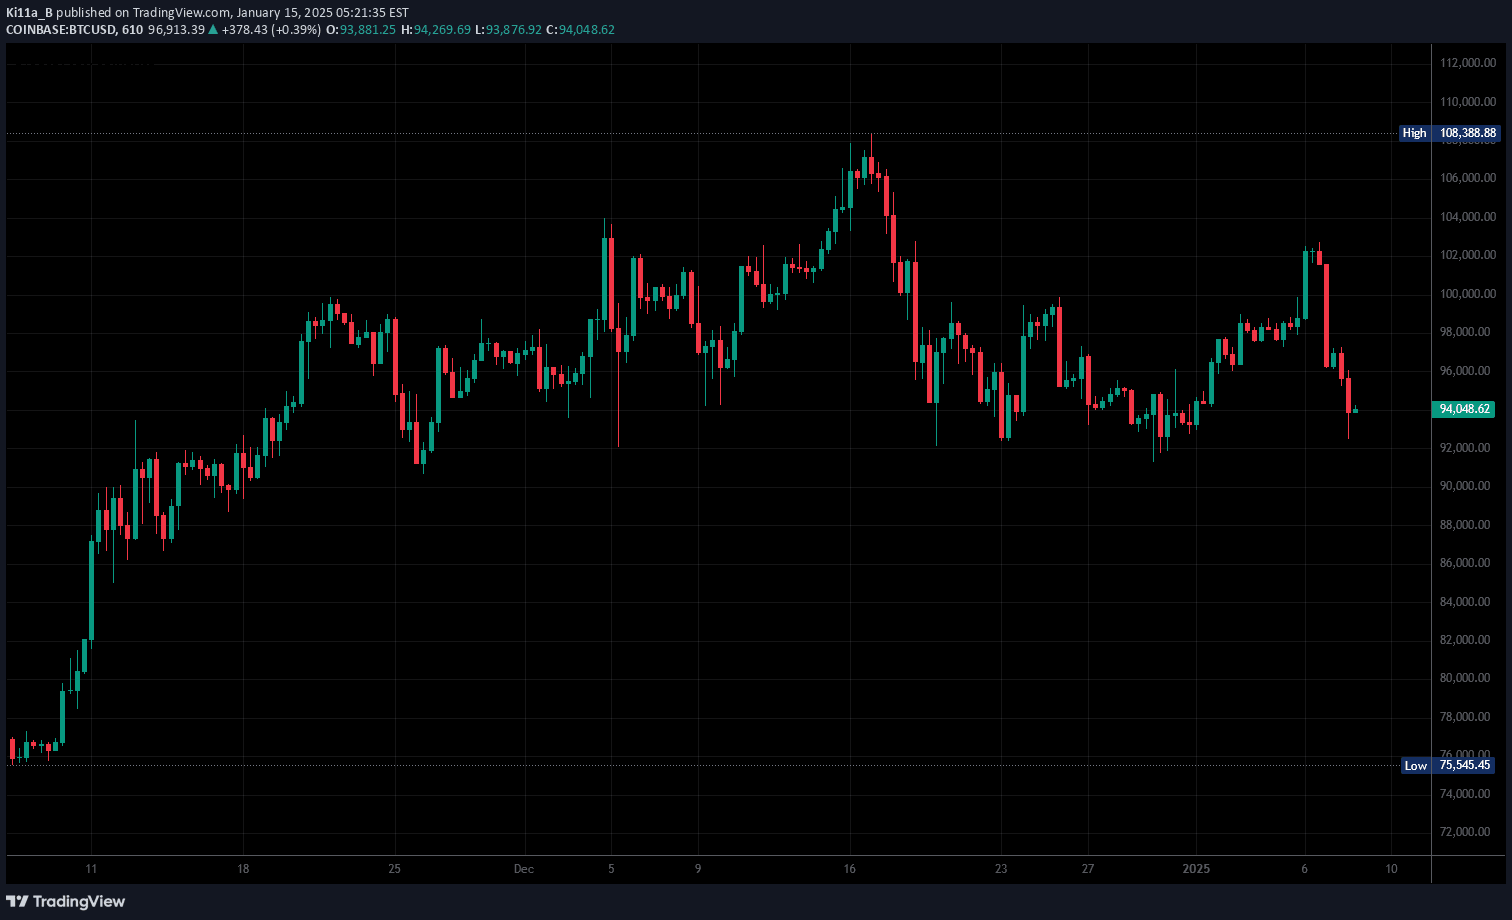
A technical indicator that visualizes price volatility using pivot points and ATR-adjusted bands to help traders identify potential support and resistance levels dynamically.
Explore complementary indicator rolesHow it works
The Pivot Length Bands indicator calculates pivot points by analyzing price action around a specified swing length. It determines pivot highs and lows by examining a defined number of candles to the left and right of each point, creating a dynamic volatility channel around the price.
The indicator incorporates Average True Range (ATR) to adjust the pivot bands, which allows the width of the bands to expand or contract based on current market volatility. This adaptive approach helps traders understand price movement range and potential support/resistance zones more effectively.
Why it may be useful
The Pivot Length Bands indicator provides traders with a visual representation of market dynamics, helping them understand price volatility and potential trend changes. By offering a flexible framework for identifying key price levels, traders can make more informed decisions about market entry and exit points.
The adaptive nature of the bands allows traders to quickly assess market conditions across different timeframes and asset classes. This versatility makes the indicator a valuable tool for risk management and strategic trade planning.
When to explore it
The Pivot Length Bands indicator works best in markets with clear trending or ranging characteristics, where price movements demonstrate consistent patterns. It is particularly effective when used alongside other technical analysis tools to confirm potential trading signals and validate market insights.
Traders should apply this indicator in markets with sufficient liquidity and volatility, such as major forex pairs, stock indices, and actively traded commodities. Its effectiveness increases when combined with complementary indicators that can provide additional confirmation of potential market movements.
Keep exploring
What we’ve verified
Access, alerts and repainting behaviour have not been independently verified for this indicator. Check the creator’s current publication and settings.
General descriptions and classifications are recovered research. Verified details above identify the specific checks we have completed. Check the creator’s current publication for later changes.