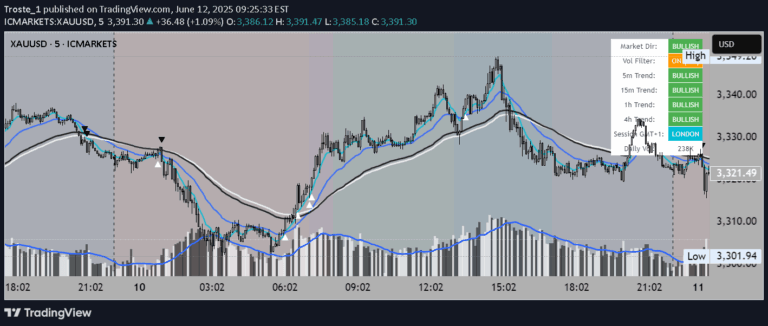
An advanced trading indicator using Average True Range to analyze market volatility, assess trend direction, and calculate optimal position sizing for enhanced trading decisions.
Explore complementary indicator rolesHow it works
The indicator calculates short-term and long-term Average True Range (ATR) values over 9 and 21 periods, respectively, to create volatility bands around the OHLC4 price. These bands are plotted with different colors and transparencies, allowing traders to visually assess market volatility dynamics.
Additionally, the indicator generates crossover labels when short-term ATR exceeds long-term ATR, signaling potential changes in market volatility. A comprehensive information table accompanies these visual elements, displaying real-time data about market conditions, including volatility status, calculated position size, and trend direction relative to a 20-period Smoothed Moving Average.
Why it may be useful
This indicator provides traders with a multi-dimensional view of market conditions by integrating volatility analysis, trend assessment, and risk management calculations into a single, comprehensive tool. By visualizing ATR bands and comparing short-term and long-term volatility, traders can gain insights into potential market movements and underlying trend strength.
The position sizing calculation and trend direction assessment help traders make more informed decisions, enabling them to manage risk effectively and align their trading strategies with current market dynamics. This holistic approach reduces emotional decision-making and promotes a more systematic trading methodology.
When to explore it
The indicator is most effective in markets experiencing moderate to high volatility, where quick changes in trend and price momentum are common. It works exceptionally well for traders seeking to understand market conditions before entering or exiting trades, particularly in assets with clear trending characteristics.
Traders should consider using this indicator during periods of market transition, such as breakouts, consolidations, or when detecting potential trend reversals. It is particularly useful for short to medium-term trading strategies across various financial instruments, including stocks, forex, cryptocurrencies, and futures markets.
Keep exploring
What we’ve verified
Access, alerts and repainting behaviour have not been independently verified for this indicator. Check the creator’s current publication and settings.
General descriptions and classifications are recovered research. Verified details above identify the specific checks we have completed. Check the creator’s current publication for later changes.