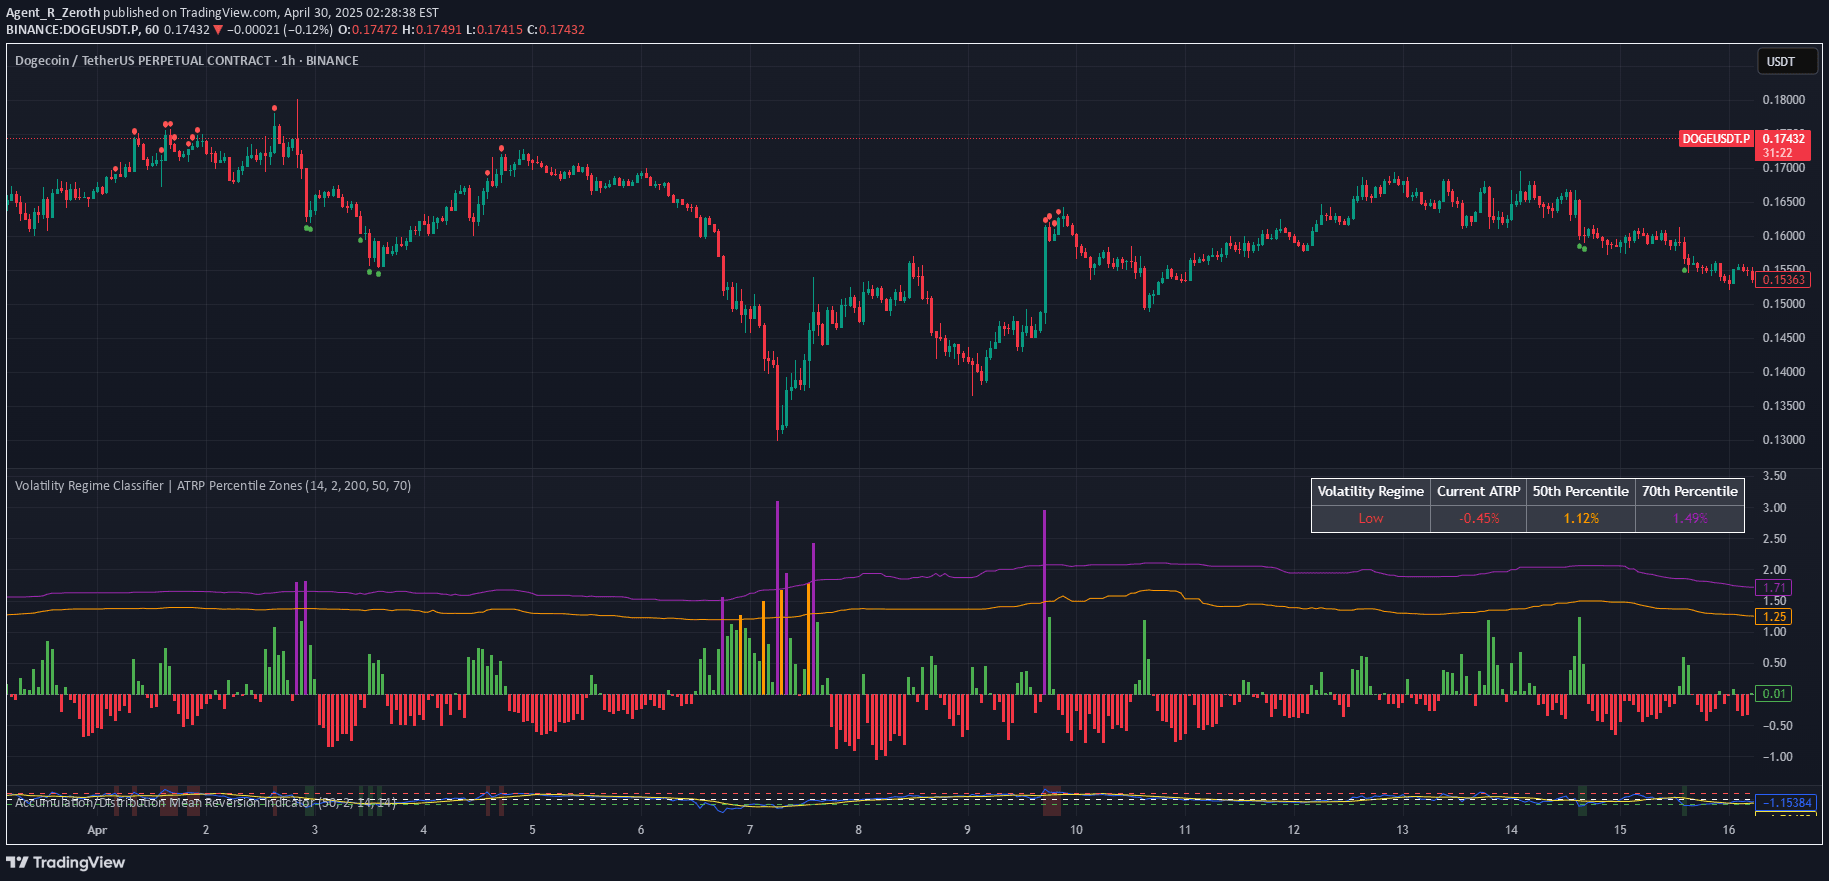
A dual-purpose indicator tracking price volatility through Average True Range percentage and detecting rapid price movements via pump/dump percentage changes in real-time.
Explore complementary indicator rolesHow it works
The ATR % component calculates the Average True Range as a percentage of price, measuring market volatility by tracking price range fluctuations. When the ATR percentage exceeds 0.10%, it signals increasing market volatility and potential breakout conditions.
The Pump % Detector simultaneously monitors percentage changes between candle open and close prices, generating alerts for sudden price movements. By tracking both upward (+0.10%) and downward (-0.10%) price spikes, traders can quickly identify momentum shifts and potential trading opportunities.
Why it may be useful
This indicator provides traders with a comprehensive view of market dynamics by combining volatility assessment and price momentum detection in a single tool. It helps traders understand underlying market conditions and potential trend acceleration more effectively than traditional single-metric indicators.
By offering real-time insights into price volatility and rapid movement detection, traders can make more informed decisions about potential entry and exit points. The indicator's ability to work across multiple timeframes makes it a versatile tool for traders seeking to capture quick market movements and emerging trends.
When to explore it
The ATR % + Pump Detector is most effective during periods of potential market transition, such as during news events, earnings releases, or significant economic announcements. It excels in identifying moments of increased market uncertainty and potential trend acceleration.
Traders should utilize this indicator when seeking to filter low-volatility setups and focus on momentum-driven trading opportunities. It is particularly useful for short-term traders who need quick, actionable insights into market behavior and are looking to capitalize on rapid price changes.
Keep exploring
What we’ve verified
Access, alerts and repainting behaviour have not been independently verified for this indicator. Check the creator’s current publication and settings.
General descriptions and classifications are recovered research. Verified details above identify the specific checks we have completed. Check the creator’s current publication for later changes.