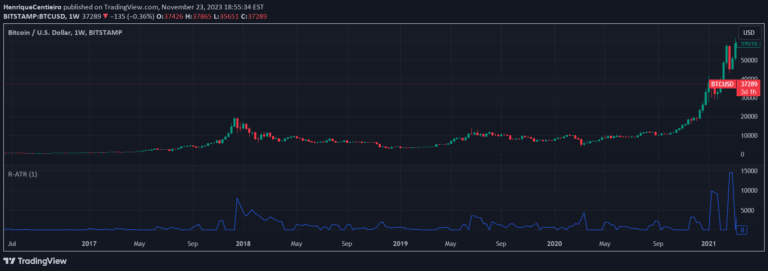
An Average True Range (ATR) indicator with customizable threshold lines to help traders assess market volatility across different financial instruments and trading strategies.
Explore complementary indicator rolesHow it works
The ATR volatility indicator calculates price range variations by measuring the maximum distance between high and low prices over a specified period. It uses a unique mathematical approach that considers gaps and limit moves, providing a comprehensive view of market price fluctuations.
By adding custom threshold lines, traders can establish specific volatility zones that help identify potential market behavior. These threshold lines act as dynamic reference points, allowing traders to adapt the indicator to different financial instruments and personal trading preferences.
Why it may be useful
Understanding market volatility is crucial for risk management and trade planning, as it helps traders anticipate potential price movements and adjust their strategies accordingly. The ATR with threshold lines provides a nuanced view of market dynamics that goes beyond simple price tracking.
By quantifying price range variations, traders can make more informed decisions about position sizing, stop-loss placement, and potential entry and exit points. This approach transforms raw price data into actionable insights that support more strategic trading approaches.
When to explore it
The ATR with threshold lines is most effective during periods of market uncertainty or when trading instruments with varying volatility characteristics. It proves particularly useful when transitioning between different market conditions or when analyzing multiple financial instruments simultaneously.
Traders should apply this indicator when seeking to establish a systematic approach to understanding price range fluctuations, especially in futures, stocks, and forex markets. It becomes an invaluable tool for identifying potential breakout points and managing risk across different trading timeframes.
Keep exploring
What we’ve verified
Access, alerts and repainting behaviour have not been independently verified for this indicator. Check the creator’s current publication and settings.
General descriptions and classifications are recovered research. Verified details above identify the specific checks we have completed. Check the creator’s current publication for later changes.