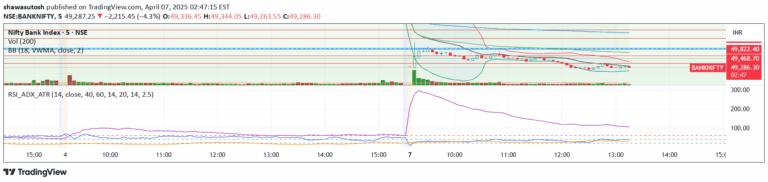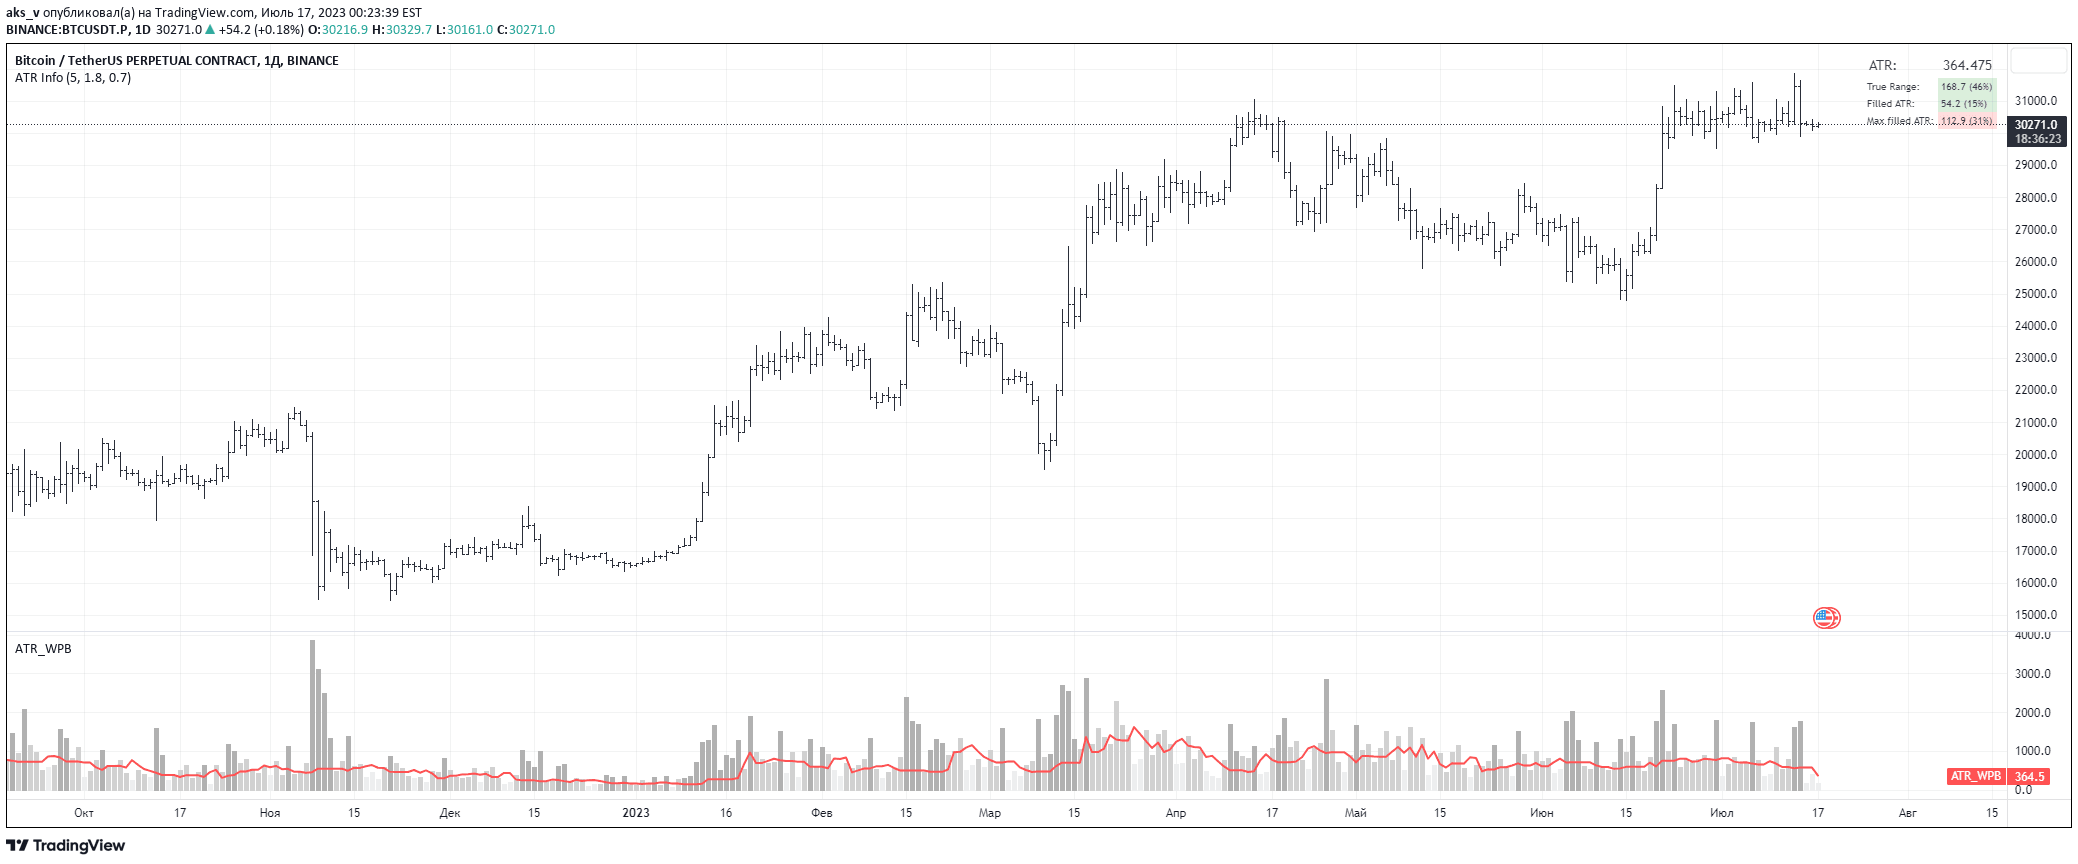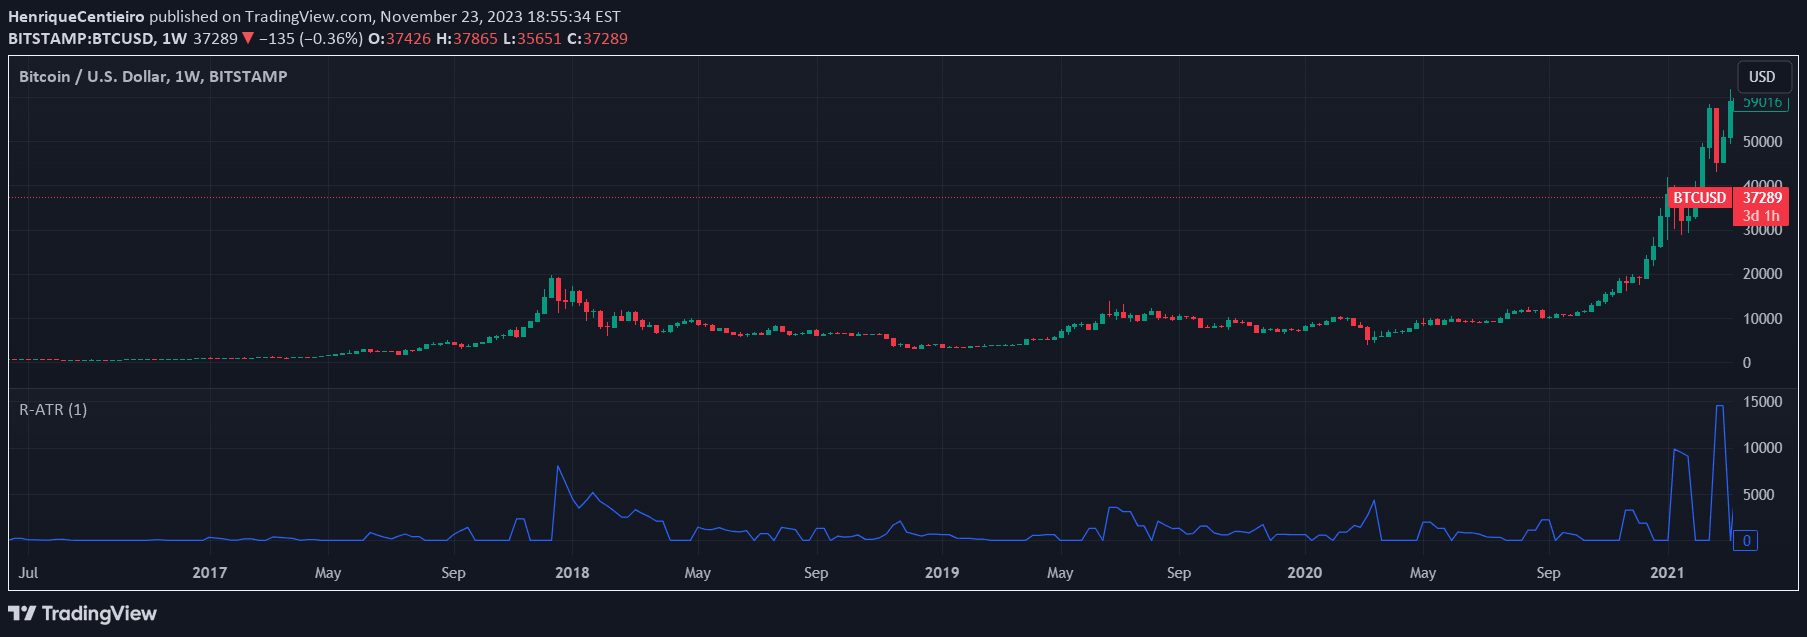
The ATR focuses on measuring market declines by calculating the average true range specifically for red candles, providing insights into potential market pullbacks and volatility.
Explore complementary indicator rolesHow it works
The Average True Range (ATR) for red candles analyzes the price range of downward-moving candles to gauge market volatility during declines. It calculates the maximum distance between a candle's high and low points, considering potential gaps or previous close prices. By focusing exclusively on red candles, this variant provides a specialized perspective on market pullback intensity.
Traders compute this by identifying red candles, measuring their true range, and then calculating the average over a specified period. This approach helps isolate and quantify downward price movements, offering a targeted view of potential market corrections and bearish momentum.
Why it may be useful
Understanding market decline volatility is crucial for risk management and strategic decision-making in trading. By measuring the average range of red candles, traders can assess the potential magnitude of market pullbacks and adjust their strategies accordingly. This metric provides insights into market sentiment during downward movements, helping traders anticipate potential trend reversals or continued bearish momentum.
The red candle ATR helps traders set more accurate stop-loss levels, determine position sizing, and evaluate potential entry and exit points during market declines. It offers a nuanced view of market behavior, enabling more informed trading decisions in volatile market conditions.
When to explore it
This ATR variant is most effective during periods of market uncertainty or potential trend reversals. Traders can utilize it during volatile market conditions, such as economic announcements, earnings reports, or significant geopolitical events that might trigger substantial price movements. It is particularly useful in identifying potential market corrections and assessing the strength of bearish trends.
The indicator works best when combined with other technical analysis tools to confirm signals and provide a comprehensive market view. Traders should consider using this ATR alongside trend indicators, support and resistance levels, and other volatility metrics to develop a robust trading strategy.
Keep exploring
What we’ve verified
Access, alerts and repainting behaviour have not been independently verified for this indicator. Check the creator’s current publication and settings.
General descriptions and classifications are recovered research. Verified details above identify the specific checks we have completed. Check the creator’s current publication for later changes.