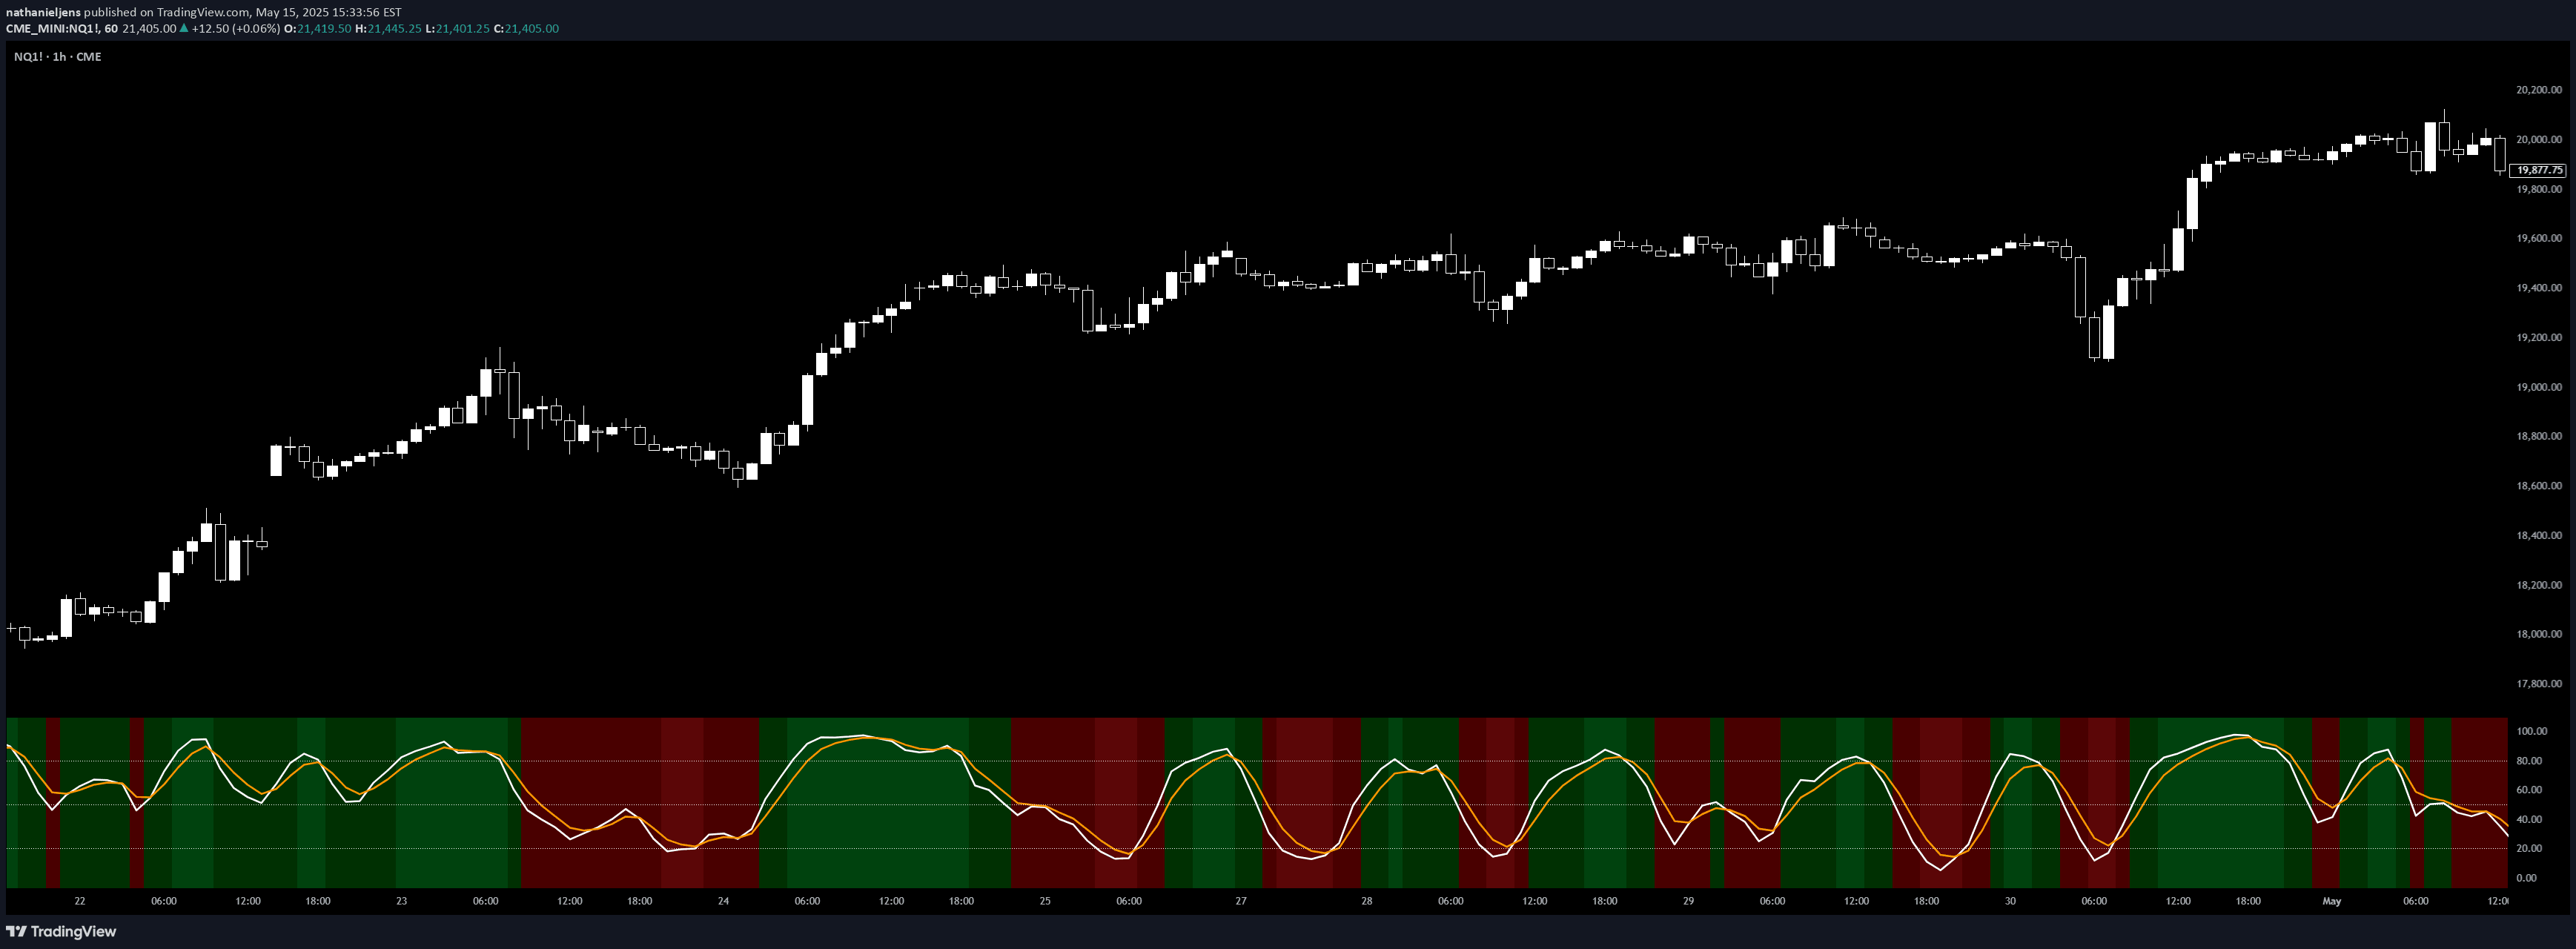
An advanced stochastic RSI indicator that averages two stochastic points of the RSI to create a smoother, more responsive momentum measurement.
Explore complementary indicator rolesHow it works
The Averaged Stochastic RSI calculates stochastic values of the RSI using two points with a difference of two. By taking the average of these stochastic values, the indicator reduces noise and creates a more refined momentum measurement. This approach allows traders to see a clearer representation of market momentum with less interference from short-term price fluctuations.
The calculation involves first generating the Relative Strength Index (RSI), then applying stochastic calculations to the RSI values. By averaging the results from two different points, the indicator smooths out potential false signals and provides a more stable view of market movement and potential trend changes.
Why it may be useful
This indicator helps traders identify market momentum with greater precision and clarity, reducing the impact of market noise that can often mislead trading decisions. By smoothing out short-term fluctuations, it provides a more reliable signal of potential trend shifts and market sentiment. The simplified approach makes it easier for traders to interpret market dynamics quickly and effectively.
The Averaged Stochastic RSI's strength lies in its ability to filter out unnecessary market volatility while maintaining sensitivity to significant price movements. This makes it particularly useful for traders who want a clearer, more streamlined view of market momentum without getting overwhelmed by complex calculations.
When to explore it
The Averaged Stochastic RSI works best in markets with clear momentum trends and during periods of moderate volatility. It is particularly effective for short to medium-term trading strategies, where quick identification of momentum shifts can provide a competitive advantage. Traders should use this indicator in conjunction with other technical analysis tools to confirm signals and validate potential trade entries and exits.
This indicator is most suitable for markets like forex, stocks, and cryptocurrencies, where rapid momentum changes can signal significant trading opportunities. It is especially useful for scalping and day trading strategies, where quick, precise momentum readings can help traders make rapid decisions based on recent market movements.
Keep exploring
What we’ve verified
Access, alerts and repainting behaviour have not been independently verified for this indicator. Check the creator’s current publication and settings.
General descriptions and classifications are recovered research. Verified details above identify the specific checks we have completed. Check the creator’s current publication for later changes.