
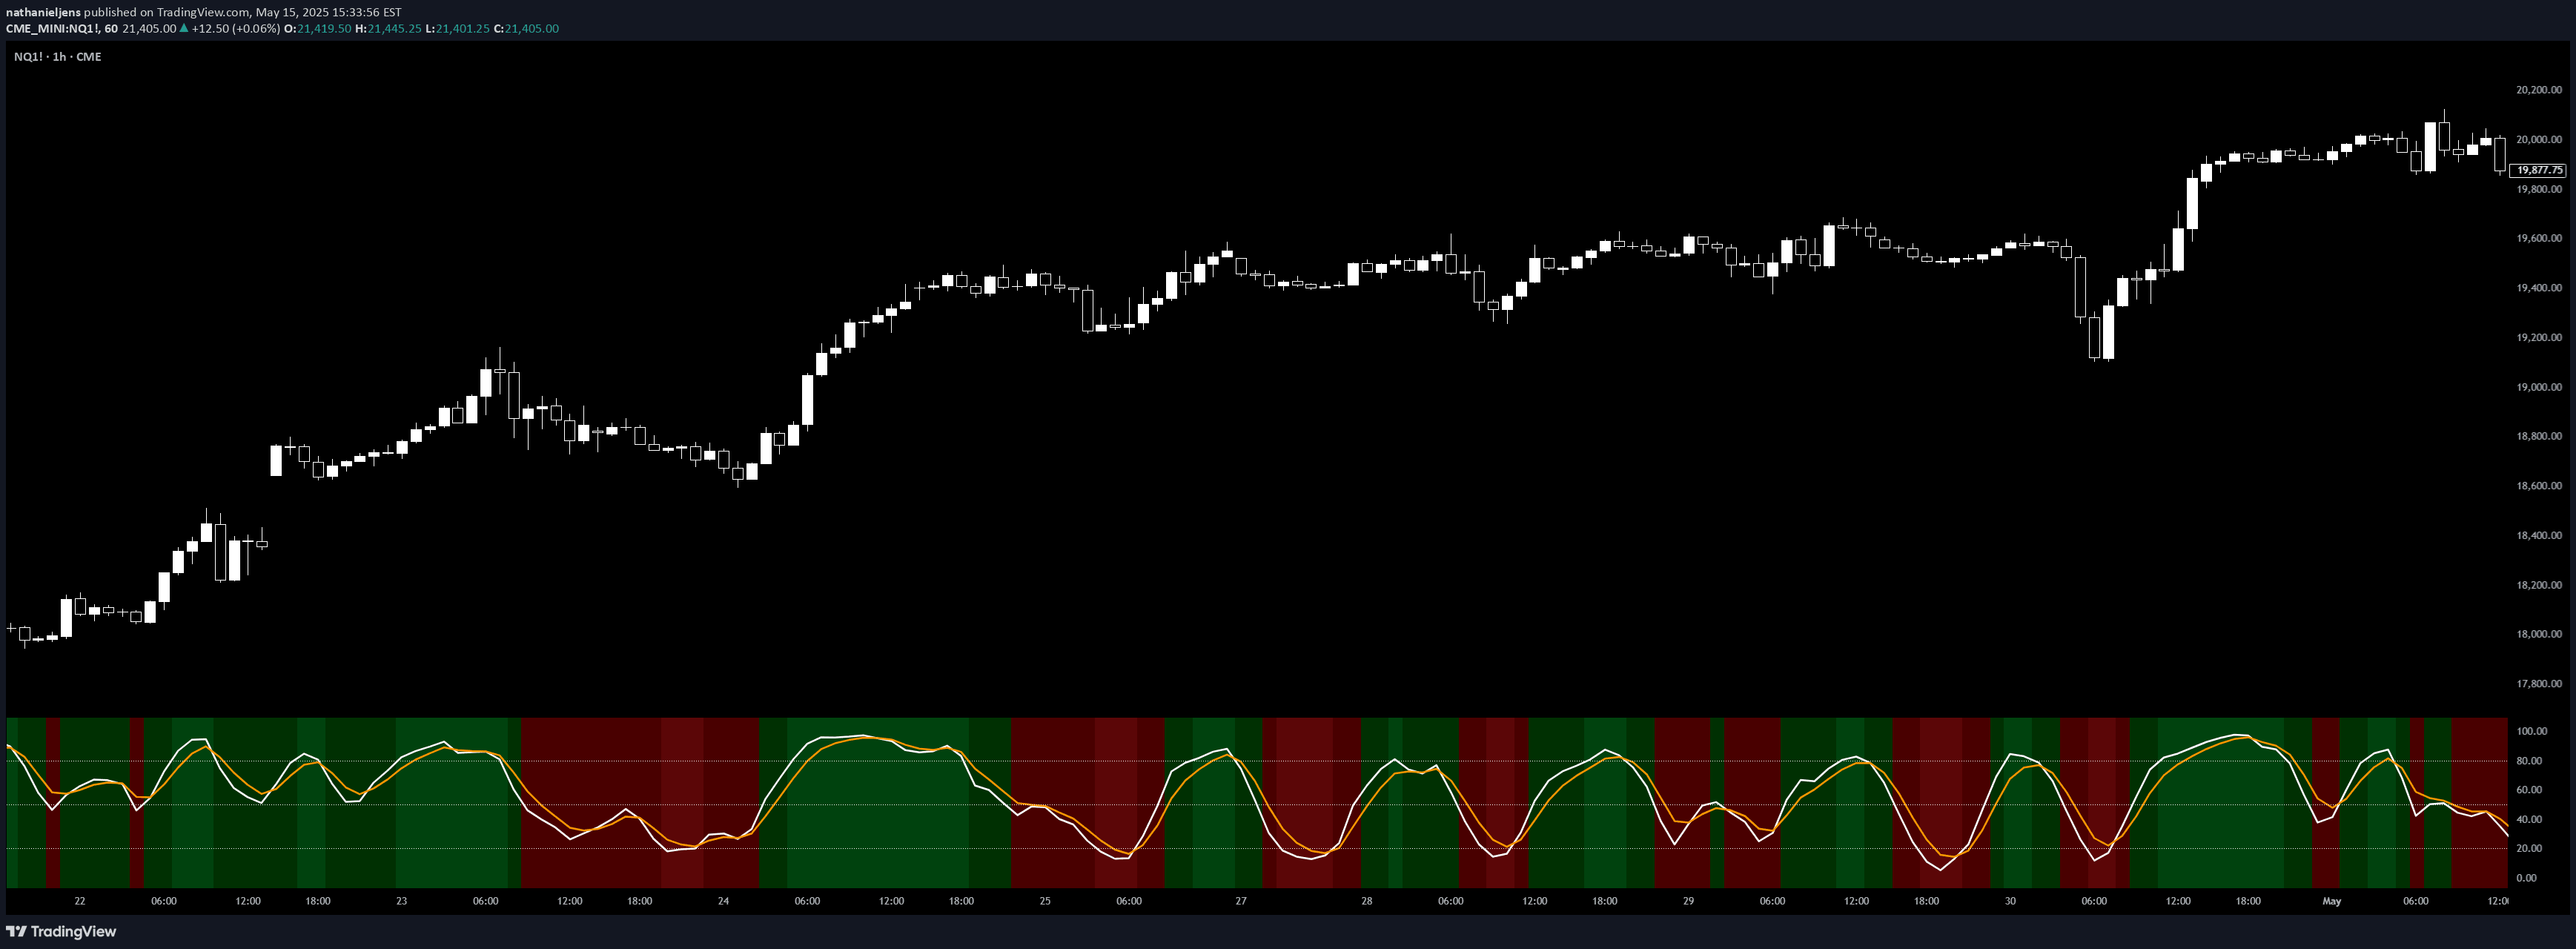
A customizable momentum oscillator that helps traders identify potential trend reversals, overbought and oversold conditions by analyzing a security's closing price relative to its price range.
Explore complementary indicator rolesHow it works
The Stochastic X indicator calculates a %K line by comparing a security's closing price to its price range over a specified period. It smooths this line using configurable moving average methods like SMA, EMA, or WMA to create a signal line.
The indicator generates visual and numerical insights by tracking the %K line's position relative to fixed levels like 50, 20, and 80. When the %K line crosses these thresholds or the signal line, it produces potential trading signals indicating momentum shifts and trend strength.
Why it may be useful
The Stochastic X provides traders with a dynamic tool for understanding market momentum and potential price reversals. By offering customizable settings and visual color-coded feedback, it helps traders quickly assess market conditions and make more informed trading decisions.
Its flexibility allows adaptation to different trading styles, market conditions, and asset behaviors. The indicator's ability to highlight overbought and oversold conditions, signal line crossovers, and trend confirmations makes it a versatile tool for analyzing price movements.
When to explore it
The Stochastic X is most effective in markets with clear trending or oscillating price movements. It works best when combined with other technical analysis tools to confirm signals and reduce false positives.
Traders should adjust the indicator's settings based on their specific trading timeframe and market characteristics. Short-term traders might use shorter periods and more responsive moving averages, while long-term traders can opt for longer periods and smoother averaging methods.
Keep exploring
What we’ve verified
Access, alerts and repainting behaviour have not been independently verified for this indicator. Check the creator’s current publication and settings.
General descriptions and classifications are recovered research. Verified details above identify the specific checks we have completed. Check the creator’s current publication for later changes.


