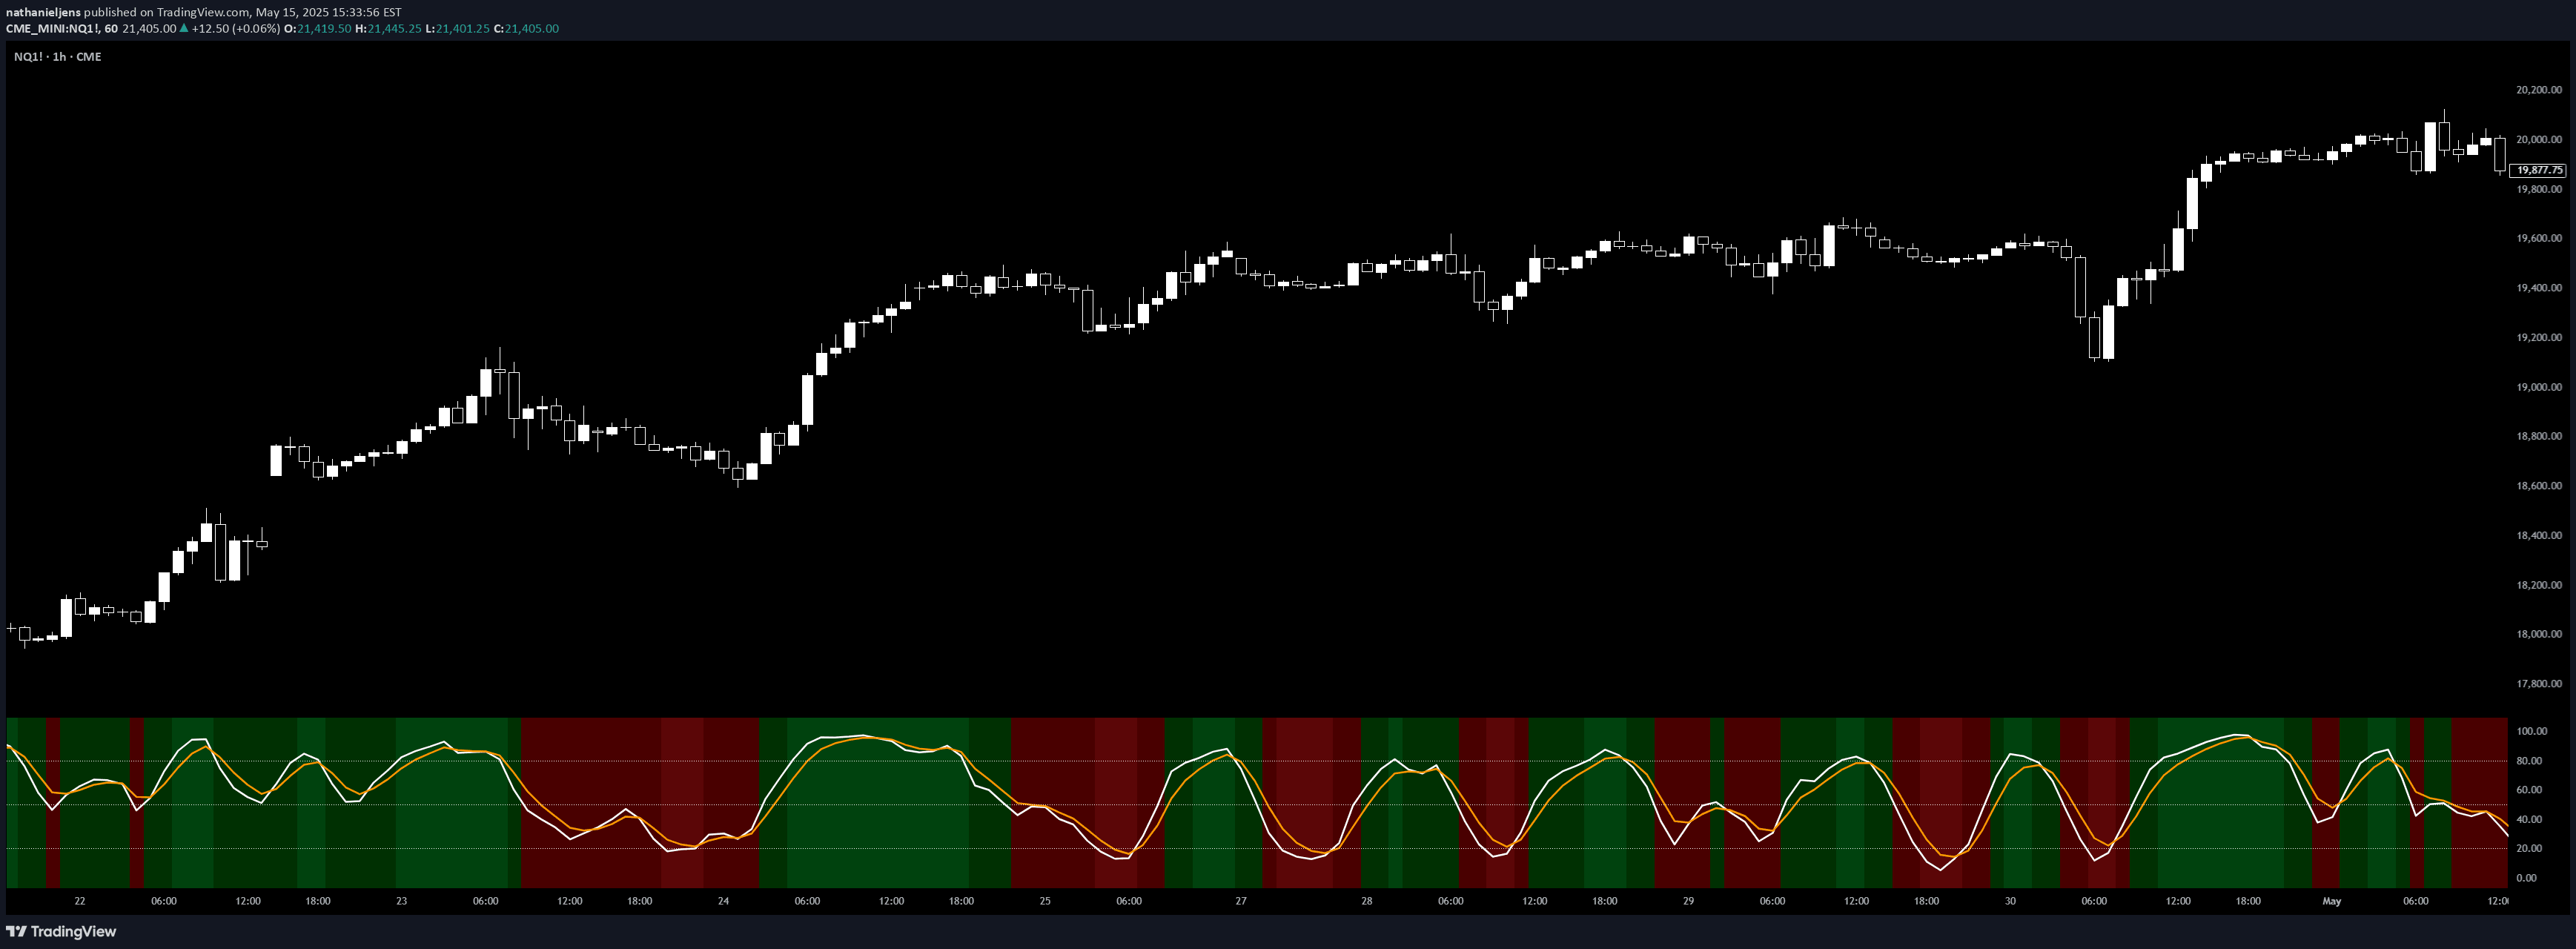
A multi-layered stochastic oscillator combining five different period lengths to provide comprehensive momentum analysis across short and long-term market conditions.
Explore complementary indicator rolesHow it works
The Stochastic Rainbow indicator calculates five stochastic oscillators using Fibonacci-based periods, each smoothed by a selected moving average method. Each oscillator generates a %K line and corresponding %D line, creating a multi-layered momentum visualization that tracks price dynamics across different timeframes.
The indicator plots these lines with distinct colors, accompanied by horizontal reference lines at 20, 50, and 80 to help traders quickly identify market conditions. By comparing the positions and relationships between different stochastic lines, traders can gain insights into momentum strength, potential trend reversals, and market sentiment.
Why it may be useful
The Stochastic Rainbow provides traders with a sophisticated tool for understanding market momentum by offering a comprehensive view of price movement across multiple timeframes simultaneously. Its multi-layered approach allows for nuanced analysis that goes beyond traditional single-period oscillators, enabling more informed trading decisions.
By integrating various stochastic calculations with customizable moving average methods, the indicator helps traders detect subtle shifts in market dynamics, identify potential trend reversals, and confirm existing market trends with greater precision and confidence.
When to explore it
The Stochastic Rainbow is most effective in markets with clear trending or ranging conditions, where momentum signals can provide reliable insights into potential price movements. Traders can optimize its use by adjusting settings to match specific market characteristics, such as using shorter periods for quick market movements or longer periods for broader trend analysis.
The indicator works particularly well when combined with other technical analysis tools, helping to confirm signals and reduce false positives. It is especially valuable during volatile market conditions, where its multi-layered approach can help filter out noise and provide more reliable momentum indications.
Keep exploring
What we’ve verified
Access, alerts and repainting behaviour have not been independently verified for this indicator. Check the creator’s current publication and settings.
General descriptions and classifications are recovered research. Verified details above identify the specific checks we have completed. Check the creator’s current publication for later changes.