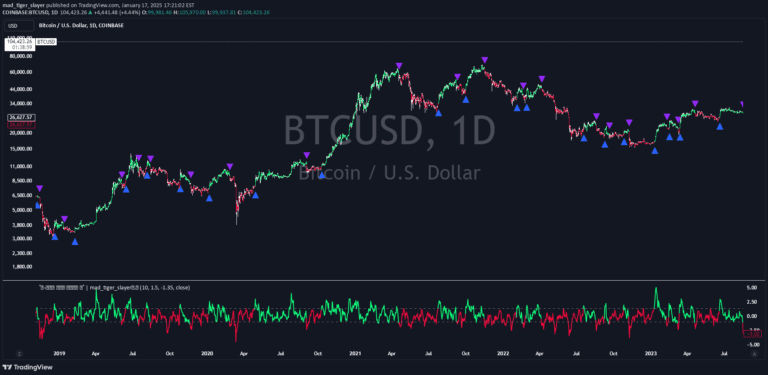
A normalized RSI indicator that provides enhanced momentum analysis by mapping values between -1 and 1, detecting trend direction and potential reversals through advanced divergence detection.
Explore complementary indicator rolesHow it works
The Normalized RSI Trendline calculates the Relative Strength Index and transforms it into a normalized range between -1 and 1, providing a more standardized view of market momentum. By applying linear regression and an adaptive moving average (ALMA), the indicator creates a smooth trendline that helps traders identify the underlying market direction with greater clarity.
The system also incorporates advanced divergence detection, which compares price action with the normalized RSI values to identify potential trend reversals. Regular and hidden divergences are highlighted, allowing traders to spot both potential trend changes and trend continuation signals through color-coded visual indicators.
Why it may be useful
Traditional RSI indicators often lack nuanced momentum representation, but this normalized approach provides traders with a more precise and adaptable tool for analyzing market conditions. By standardizing RSI values, traders gain a clearer understanding of momentum strength and direction, reducing the ambiguity often associated with standard oscillator interpretations.
The divergence detection feature adds significant value by offering early warning signals for potential trend reversals or continuations. This allows traders to make more informed decisions, anticipate potential market movements, and develop more sophisticated trading strategies based on momentum and trend dynamics.
When to explore it
The Normalized RSI Trendline is most effective in markets with clear trending characteristics, where momentum plays a crucial role in price movement. It performs exceptionally well in moderate to high volatility environments, where momentum shifts can signal significant potential trade opportunities. Traders should pay particular attention to the indicator during market transitions and potential trend reversal zones.
This indicator is especially useful for traders who prefer a combination of trend-following and momentum-based strategies. It works best when integrated with other technical analysis tools, providing confirmation signals and helping to filter out false market noise. Traders should customize the indicator's parameters to match their specific trading style and the characteristics of the financial instrument they are analyzing.
Keep exploring
What we’ve verified
Access, alerts and repainting behaviour have not been independently verified for this indicator. Check the creator’s current publication and settings.
General descriptions and classifications are recovered research. Verified details above identify the specific checks we have completed. Check the creator’s current publication for later changes.