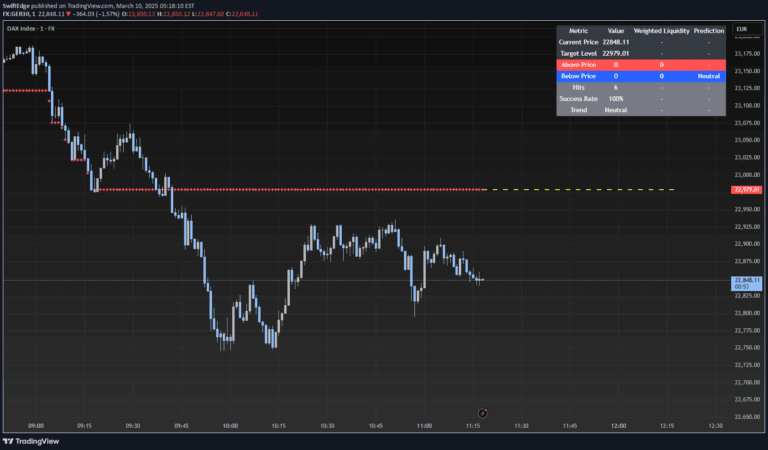
An advanced SMC-based indicator that identifies key market structure elements like Break of Structure, Change of Character, and key support/resistance zones for precise trading decisions.
Explore complementary indicator rolesHow it works
The Aviad SMC Flow Indicator operates by analyzing price action and market structure through advanced algorithmic detection of key trading patterns. It automatically identifies critical market events like Break of Structure (BoS), Change of Character (CHoCH), and Market Structure Shift (MSS) using sophisticated computational techniques.
By tracking historical price movements and liquidity zones, the indicator generates precise visual markers that highlight potential reversal points and significant structural changes in the market's behavior. These markers help traders quickly recognize important trading opportunities and potential trend shifts across multiple timeframes.
Why it may be useful
The SMC Flow Indicator provides traders with a comprehensive visual framework for understanding complex market dynamics through Smart Money Concepts. By revealing hidden market structures and liquidity zones, traders can make more informed and strategic trading decisions with enhanced precision and confidence.
Unlike traditional indicators, this tool offers a holistic view of market movements, helping traders identify high-probability entry and exit points. Its ability to highlight key structural changes allows traders to align their strategies with professional institutional trading approaches.
When to explore it
The Aviad SMC Flow Indicator is most effective when used on 1-hour and lower timeframes, making it ideal for intraday and short-term trading strategies. Traders can leverage this tool during periods of market volatility and when seeking to identify potential trend reversals or continuation patterns.
It is particularly useful in markets with clear structural movements, such as forex, cryptocurrencies, and actively traded stock indices. Traders should combine this indicator with other technical analysis tools and risk management strategies to maximize its effectiveness.
Keep exploring
What we’ve verified
Access, alerts and repainting behaviour have not been independently verified for this indicator. Check the creator’s current publication and settings.
General descriptions and classifications are recovered research. Verified details above identify the specific checks we have completed. Check the creator’s current publication for later changes.