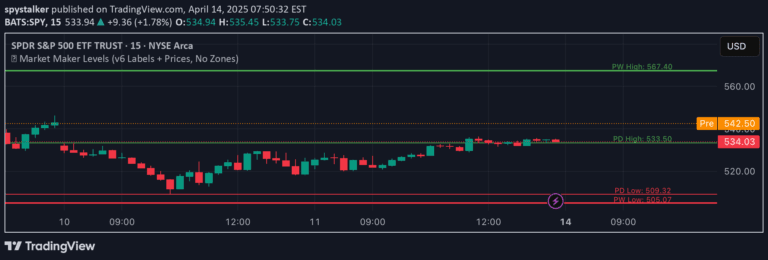
The Opening Range Breakout strategy identifies key price levels during the first trading hours, generating buy or sell signals when price breaks above or below these initial range boundaries.
Explore complementary indicator rolesHow it works
The Opening Range Breakout strategy begins by defining a specific time window after market open, typically the first 15-30 minutes of trading. During this period, traders carefully track and record the highest and lowest price points, which become critical reference levels for potential trading signals.
Once the opening range is established, traders look for price movements that break beyond these predefined boundaries. A price breakthrough above the opening range high suggests a bullish signal and potential long trade, while a break below the opening range low indicates a bearish signal and potential short trade.
Why it may be useful
The Opening Range Breakout strategy provides traders with a structured approach to capturing early market momentum and identifying potential trend directions. By focusing on the initial trading hours, this method helps traders leverage the inherent volatility and directional movements that often occur right after market open.
This strategy is particularly valuable because it offers clear, objective entry and exit points based on observable price action. Traders can use these signals to make more informed decisions, reducing emotional trading and providing a systematic framework for identifying high-probability trading opportunities.
When to explore it
The Opening Range Breakout strategy is most effective in liquid, actively traded markets with significant early morning price movement. It works best in markets like stocks, futures, and forex, where the first trading hours typically demonstrate clear directional bias and substantial trading volume.
Traders should be cautious during low-volatility periods, earnings announcements, or major economic events that might disrupt typical market behavior. The strategy is most reliable when used in conjunction with other technical analysis tools and proper risk management techniques.
Keep exploring
What we’ve verified
Access, alerts and repainting behaviour have not been independently verified for this indicator. Check the creator’s current publication and settings.
General descriptions and classifications are recovered research. Verified details above identify the specific checks we have completed. Check the creator’s current publication for later changes.