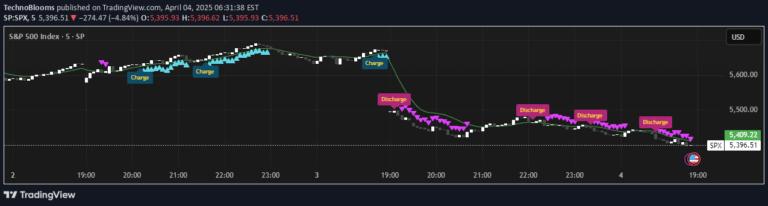
A polychromatic momentum indicator that calculates price differences and applies smoothing to reveal underlying price movement trends and potential trading signals.
Explore complementary indicator rolesHow it works
The Polychromatic Momentum Indicator (PMI) calculates momentum by taking the difference between the current price and a price from n periods ago. It then subtracts this difference divided by the number of periods, creating a smoothed momentum measurement. This approach helps reduce noise and provide a more stable representation of price movement dynamics.
By incorporating a smoothing factor, traders can further refine the indicator's sensitivity. The smoothing process applies a simple moving average to the base momentum calculation, which helps filter out short-term price fluctuations and reveal more meaningful trend information.
Why it may be useful
Momentum indicators are crucial for understanding the speed and strength of price movements in financial markets. By measuring the rate of price change, traders can identify potential trend reversals, confirm existing trends, and assess the underlying market sentiment. The PMI provides a nuanced view of price momentum that goes beyond simple price differences.
The smoothing mechanism of this indicator makes it particularly valuable for traders seeking to reduce market noise and focus on more significant price trends. It helps traders distinguish between meaningful price movements and random market fluctuations, enabling more informed trading decisions.
When to explore it
The Polychromatic Momentum Indicator is most effective in markets with clear directional movements and moderate volatility. It works well for traders seeking to identify emerging trends and potential entry or exit points in short to medium-term trading scenarios. The indicator is particularly useful in markets like forex, stocks, and cryptocurrency where price momentum can provide significant trading signals.
Traders should use this indicator in conjunction with other technical analysis tools to confirm signals and reduce false positives. It is most reliable when combined with trend-following or trend-confirmation indicators, helping to provide a more comprehensive view of market dynamics and potential trading opportunities.
Keep exploring
What we’ve verified
Access, alerts and repainting behaviour have not been independently verified for this indicator. Check the creator’s current publication and settings.
General descriptions and classifications are recovered research. Verified details above identify the specific checks we have completed. Check the creator’s current publication for later changes.