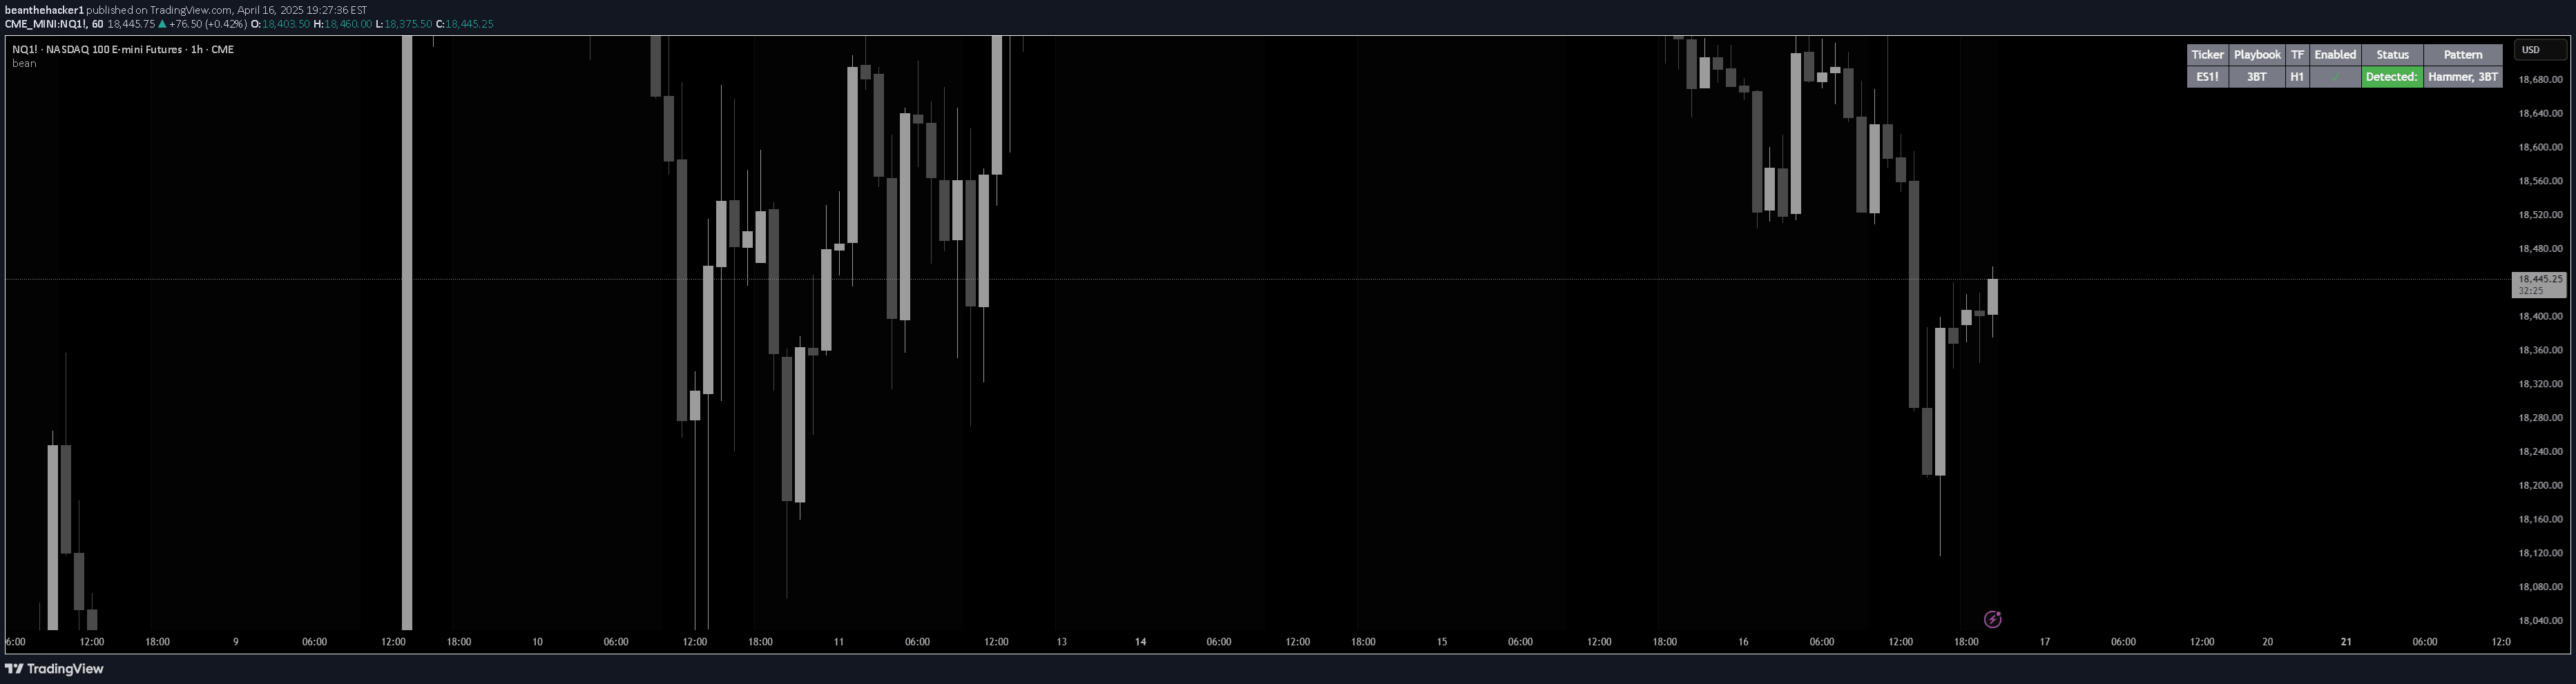
A multi-instrument pattern scanner that identifies specific candlestick formations and price action patterns across H1 timeframes, providing real-time trading signals and visual alerts.
Explore complementary indicator rolesHow it works
Bean's Multi-Instrument Pattern Scanner operates by systematically analyzing hourly candles for distinct technical patterns such as Hammer, Shooting Star, Outside/Inside bars, Umbrella formations, and Three Bar Triangles. The scanner uses precise mathematical calculations comparing open, close, high, and low prices to detect specific geometric and structural characteristics within sequential price bars.
Each pattern is evaluated using strict criteria involving body size, wick lengths, and relative positioning between consecutive candles. The indicator automatically scans completed H1 candles, instantly recognizing and flagging patterns that meet predefined technical conditions, which helps traders quickly identify potential trading opportunities.
Why it may be useful
Technical pattern recognition provides traders with structured insights into potential market sentiment shifts and price action dynamics that might be challenging to identify manually. By systematically scanning for specific candlestick formations, traders can gain objective, rule-based perspectives on potential trend reversals, consolidations, and momentum changes across multiple instruments.
The multi-instrument approach allows traders to efficiently monitor various markets simultaneously, reducing subjective interpretation and providing consistent, algorithmic pattern detection. This systematic method helps traders make more informed decisions by highlighting statistically significant price action configurations that could signal upcoming market movements.
When to explore it
The pattern scanner is most effective during periods of market transition, where price action shows signs of potential trend reversal or consolidation. Traders should focus on using this tool during times of moderate market volatility, where clear candlestick formations are more likely to emerge and provide meaningful signals.
Ideal usage includes monitoring trending markets, range-bound conditions, and periods of price compression where distinct geometric patterns are more probable. Traders should combine this scanner with additional confirmation indicators and fundamental analysis to enhance signal reliability and reduce false positive pattern detections.
Keep exploring
What we’ve verified
Access, alerts and repainting behaviour have not been independently verified for this indicator. Check the creator’s current publication and settings.
General descriptions and classifications are recovered research. Verified details above identify the specific checks we have completed. Check the creator’s current publication for later changes.