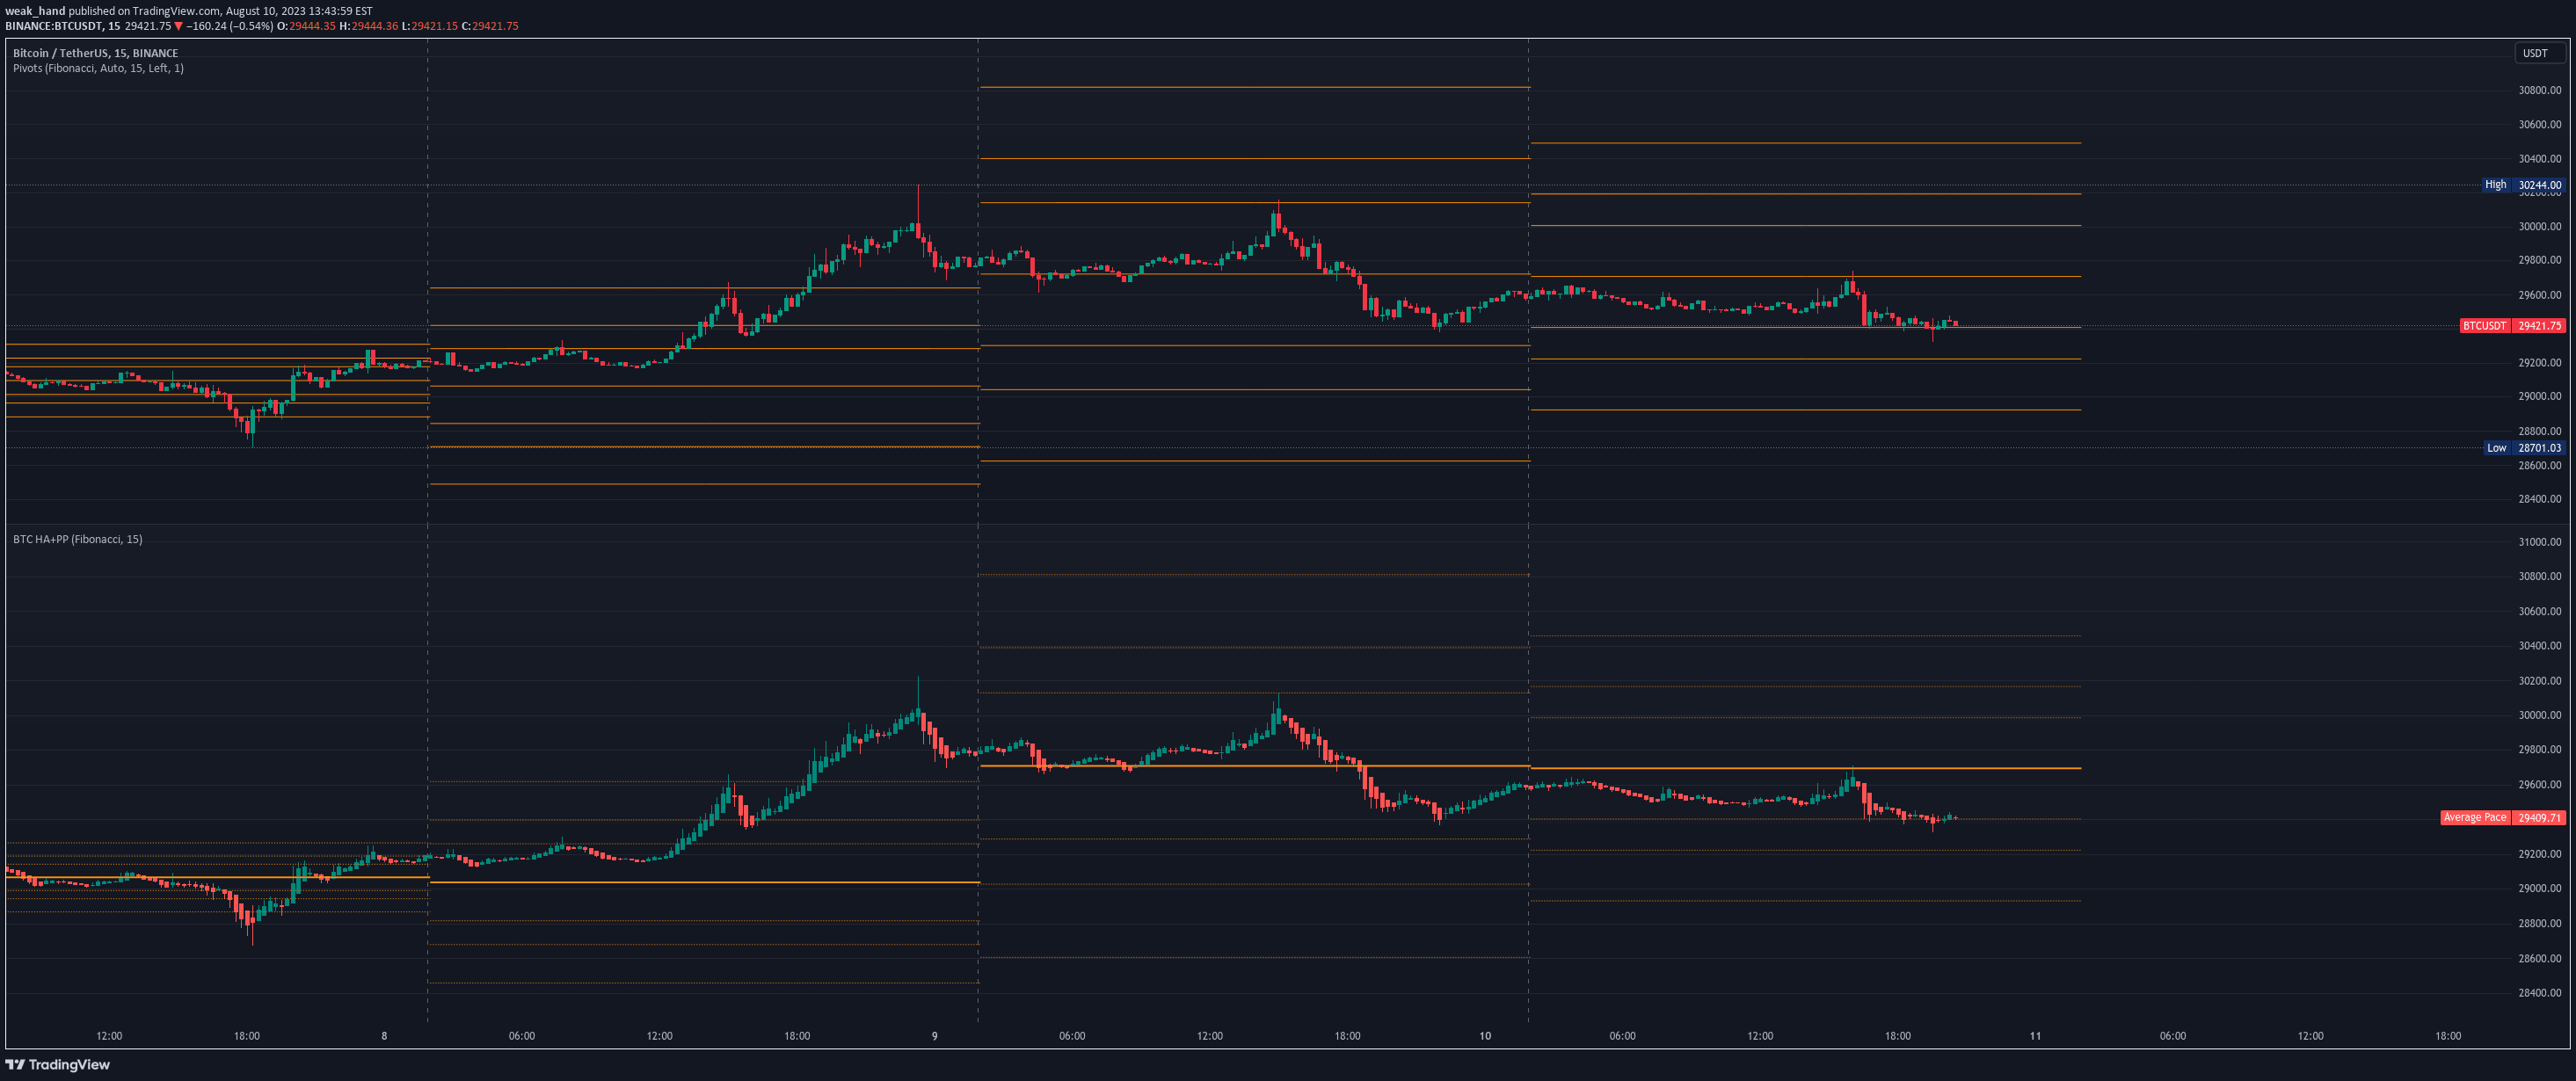
A unique trading indicator combining Heikin Ashi candles with pivot points, offering dynamic support and resistance levels across multiple timeframes for Bitcoin analysis.
Explore complementary indicator rolesHow it works
This indicator combines Heikin Ashi candles with pivot point calculations to generate dynamic support and resistance levels. By automatically adjusting pivot points based on the chart's timeframe, it provides traders with flexible analytical insights, switching between traditional, Fibonacci, Woodie, Classic, DM, and Camarilla pivot point methods.
The system dynamically calculates pivots for different time periods, including daily, weekly, and monthly intervals. When applied to an intraday chart, it generates daily pivot points for Heikin Ashi candles, while daily charts produce weekly pivots and monthly charts generate yearly pivot calculations.
Why it may be useful
The indicator offers traders a comprehensive view of potential price movements by integrating Heikin Ashi candle visualization with pivot point analysis. By combining these two powerful analytical tools, traders can gain deeper insights into market trends, support and resistance levels, and potential price direction changes.
Particularly useful for Bitcoin and altcoin trading, this indicator provides a nuanced approach to market analysis that goes beyond traditional charting methods. Its ability to adapt to different timeframes and pivot point styles makes it a versatile tool for traders seeking to understand market dynamics and potential trend reversals.
When to explore it
This indicator is most effective when trading Bitcoin and potentially correlated altcoins, particularly during periods of market uncertainty or when seeking to identify key support and resistance levels. It works best on intraday, daily, and monthly charts, providing traders with flexible insights across different trading timeframes.
Traders should consider using this indicator during market transitions, trend confirmations, and when looking to validate potential entry or exit points. Its lagging nature means it is most valuable when combined with other leading indicators and used as part of a comprehensive trading strategy.
Keep exploring
What we’ve verified
Access, alerts and repainting behaviour have not been independently verified for this indicator. Check the creator’s current publication and settings.
General descriptions and classifications are recovered research. Verified details above identify the specific checks we have completed. Check the creator’s current publication for later changes.