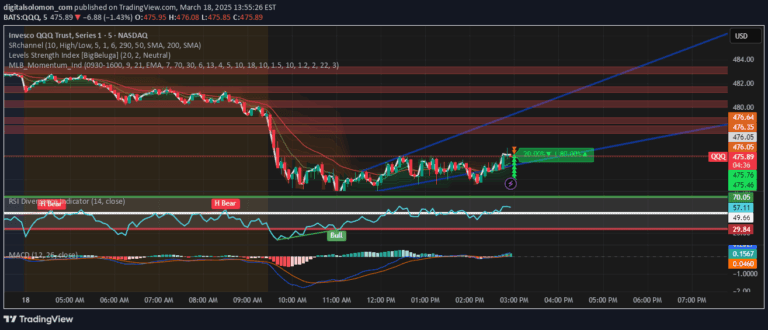
A swing reversal indicator that combines smoothed price data with a modified RSI to help traders identify potential market trend changes and momentum shifts.
Explore complementary indicator rolesHow it works
The L1 Swing Reversal indicator operates by calculating smoothed price components and an adjusted RSI using multiple periods and input parameters. It processes high, low, close, and open prices through a series of mathematical transformations, including simple moving averages, standard deviations, and exponential moving averages.
The calculation generates color-coded columns representing price dynamics and an RSI line that helps identify potential market reversal points. By smoothing and filtering price data, the indicator aims to reduce noise and provide clearer signals about potential trend changes and momentum shifts.
Why it may be useful
The L1 Swing Reversal indicator is valuable for traders because it combines multiple analytical techniques to provide a nuanced view of market momentum and potential trend reversals. By integrating smoothed price data with a modified RSI, the indicator offers a more comprehensive assessment of market conditions than traditional single-metric approaches.
This sophisticated approach helps traders identify potential entry and exit points with greater confidence, reducing the impact of market noise and providing a more structured method for analyzing price movements and momentum shifts.
When to explore it
The L1 Swing Reversal indicator is most effective in markets with clear trending or transitional characteristics, where momentum shifts are significant. It performs best in timeframes that allow sufficient data for smoothing and calculation, typically on daily, 4-hour, or 1-hour charts where price movements are more deliberate and meaningful.
Traders should use this indicator in conjunction with other technical analysis tools to confirm signals and reduce false positives. It is particularly useful in markets with moderate volatility, where price trends are more predictable and momentum changes are more discernible.
Keep exploring
What we’ve verified
Access, alerts and repainting behaviour have not been independently verified for this indicator. Check the creator’s current publication and settings.
General descriptions and classifications are recovered research. Verified details above identify the specific checks we have completed. Check the creator’s current publication for later changes.