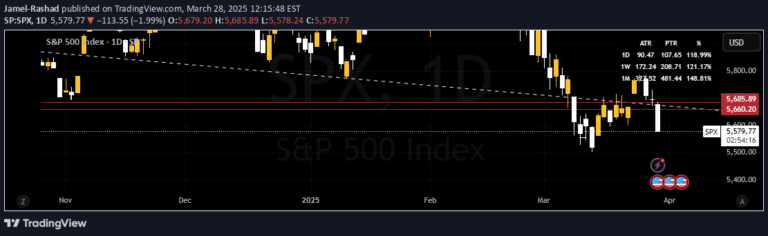
VQI measures market volatility quality by analyzing price movements and providing a numerical value that helps traders assess market stability and potential trading risks.
Explore complementary indicator rolesHow it works
The Volatility Quality Index (VQI) calculates market volatility by dividing price range by Average True Range (ATR) multiplied by a factor. It observes price movements and generates a numerical value that represents market volatility intensity and characteristics.
By analyzing the relationship between price range and ATR, VQI provides traders with a comprehensive view of market volatility. The calculation involves specific period lengths and multiple factors that help determine the quality and stability of price movements across different trading instruments.
Why it may be useful
VQI helps traders understand market volatility dynamics, enabling more informed decision-making and risk management strategies. By providing a clear numerical representation of market volatility, traders can better assess potential trading opportunities and adjust their approaches accordingly.
The indicator allows traders to gauge market stability and risk levels, which is crucial for developing robust trading strategies. It provides insights into market conditions that might not be immediately apparent through price action alone, helping traders make more nuanced and calculated trading decisions.
When to explore it
VQI works best in markets with significant price movements and during periods of changing volatility. Traders can utilize this indicator when seeking to understand market conditions, assess potential trading risks, and identify periods of high or low market stability.
The indicator is particularly useful when transitioning between different market phases, such as from trending to consolidating markets. Traders can use VQI to complement other technical analysis tools, helping them make more comprehensive and informed trading decisions across various timeframes and market conditions.
Keep exploring
What we’ve verified
Access, alerts and repainting behaviour have not been independently verified for this indicator. Check the creator’s current publication and settings.
General descriptions and classifications are recovered research. Verified details above identify the specific checks we have completed. Check the creator’s current publication for later changes.