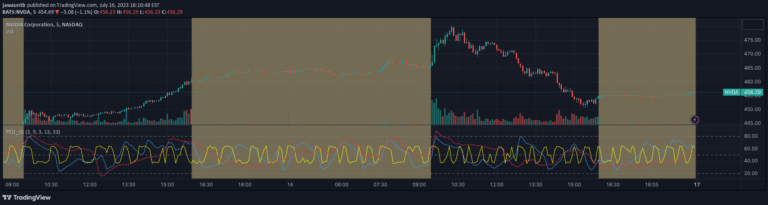
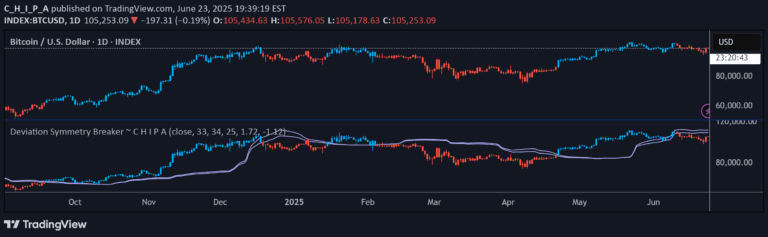
A custom indicator combining VixFix and RSI to provide a comprehensive view of market volatility and momentum, using advanced scaling and smoothing techniques.
Explore complementary indicator rolesHow it works
The Inverted VixFix Indicator with RSI Scaling operates by first calculating the VixFix, which measures market volatility using the highest close and lowest low of the past 22 bars. It then scales the VixFix and RSI to a consistent range between 0 and 100, allowing for direct comparison of these two different indicators.
The script applies the ALMA (Arnaud Legoux Moving Average) to smooth the scaled RSI, which helps reduce noise and provide a more stable signal. By combining these two technical indicators, the script creates a nuanced view of market conditions that captures both momentum and volatility in a single, comprehensive indicator.
Why it may be useful
This indicator is valuable because it integrates multiple analytical perspectives, providing traders with a more holistic view of market dynamics. By combining volatility and momentum measurements, traders can gain deeper insights into potential market movements that might be missed by using a single indicator.
The advanced scaling and smoothing techniques ensure that the indicator is more responsive and less prone to false signals. This makes it particularly useful for traders seeking a more sophisticated and robust tool for market analysis and decision-making.
When to explore it
The Inverted VixFix Indicator with RSI Scaling is most effective during periods of market uncertainty or transition, where understanding both volatility and momentum can provide a competitive edge. It is particularly useful in markets with significant price fluctuations, where traditional single-dimensional indicators might provide incomplete information.
Traders can benefit from this indicator across various timeframes, from scalping to swing trading, making it a versatile tool for different trading strategies. It is especially valuable when looking to confirm trend strength, identify potential reversals, or assess overall market sentiment.
Keep exploring
What we’ve verified
Access, alerts and repainting behaviour have not been independently verified for this indicator. Check the creator’s current publication and settings.
General descriptions and classifications are recovered research. Verified details above identify the specific checks we have completed. Check the creator’s current publication for later changes.