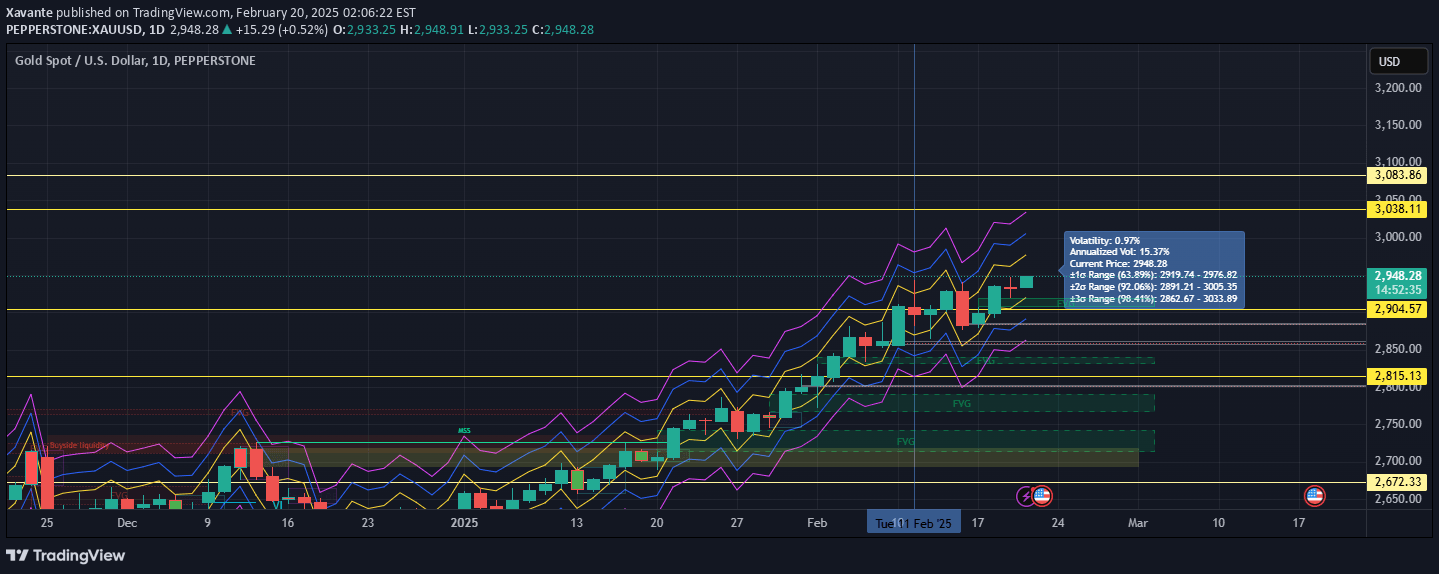
A custom indicator combining RSI and Deviation to analyze market volatility by measuring price fluctuations and identifying potential trend changes through deviation and momentum analysis.
Explore complementary indicator rolesHow it works
The RSI and Dev Advanced Volatility Index calculates price deviations by measuring the difference between closing prices and a 10-period simple moving average. It then applies the Relative Strength Index (RSI) to these deviations to create a volatility measurement tool that tracks market momentum.
By transforming price deviations into an RSI oscillator, the indicator generates a dynamic representation of market volatility. The process involves smoothing price movements and converting them into a readable format that oscillates between 0 and 110, with key reference points at 50 to indicate volatility transitions.
Why it may be useful
This volatility indicator provides traders with a nuanced understanding of market dynamics by combining two powerful analytical tools: deviation and RSI. It offers insights into market conditions that go beyond traditional price analysis, helping traders identify potential trend shifts and volatility changes more effectively.
By presenting volatility in an easily interpretable format, the indicator allows traders to make more informed decisions about market entry and exit points. It helps manage risk by highlighting periods of low and high volatility, enabling traders to adjust their strategies accordingly and potentially improve their trading performance.
When to explore it
The RSI and Dev Advanced Volatility Index is most effective during periods of market transition, such as when prices are consolidating or potentially preparing for a trend reversal. Traders can use this indicator to identify moments of increasing or decreasing market volatility, which can signal potential trading opportunities.
It is particularly useful in markets that exhibit significant price fluctuations, such as cryptocurrency, forex, or stocks with high trading volumes. Traders should combine this indicator with other technical analysis tools to confirm signals and develop a comprehensive trading strategy.
Keep exploring
What we’ve verified
Access, alerts and repainting behaviour have not been independently verified for this indicator. Check the creator’s current publication and settings.
General descriptions and classifications are recovered research. Verified details above identify the specific checks we have completed. Check the creator’s current publication for later changes.