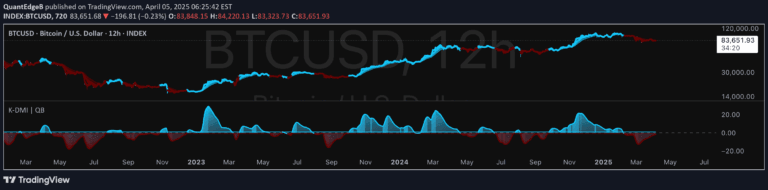
The L3 Magic-9 Sequential MACD is an advanced indicator that enhances traditional MACD by incorporating sequential patterns to identify potential buy and sell signals with custom logic.
Explore complementary indicator rolesHow it works
The L3 Magic-9 Sequential MACD builds upon the traditional MACD by calculating the standard MACD line, signal line, and histogram with enhanced analytical capabilities. It generates colored histograms that visually represent the momentum and relationship between the MACD and signal lines, with positive bars indicating bullish momentum and negative bars showing bearish trends.
The indicator goes beyond standard MACD by introducing sequential pattern recognition, which assigns numerical labels to specific trading conditions. These sequential markers help traders identify unique momentum shifts and potential entry or exit points by analyzing the intricate patterns within the MACD line's movement.
Why it may be useful
The L3 Magic-9 Sequential MACD provides traders with a more sophisticated analysis of market momentum by adding depth to traditional MACD interpretation. By incorporating sequential patterns and custom labeling, the indicator offers insights that go beyond simple line crossovers, allowing traders to understand more nuanced market dynamics and potential trend changes.
The visual representation through colored histograms and numerical markers makes it easier for traders to quickly assess market conditions and identify potential trading opportunities. This enhanced approach helps traders make more informed decisions by providing a comprehensive view of momentum and trend strength.
When to explore it
The L3 Magic-9 Sequential MACD is most effective in markets with clear trending characteristics, where momentum shifts can be reliably detected and analyzed. It works best in liquid markets with sufficient trading volume, such as major currency pairs, stock indices, and popular commodities where price movements are more predictable.
Traders should use this indicator in conjunction with other technical analysis tools to confirm signals and reduce the risk of false interpretations. It is particularly useful for traders who want a more detailed understanding of momentum changes and are comfortable with interpreting complex indicator signals.
Keep exploring
What we’ve verified
Access, alerts and repainting behaviour have not been independently verified for this indicator. Check the creator’s current publication and settings.
General descriptions and classifications are recovered research. Verified details above identify the specific checks we have completed. Check the creator’s current publication for later changes.