
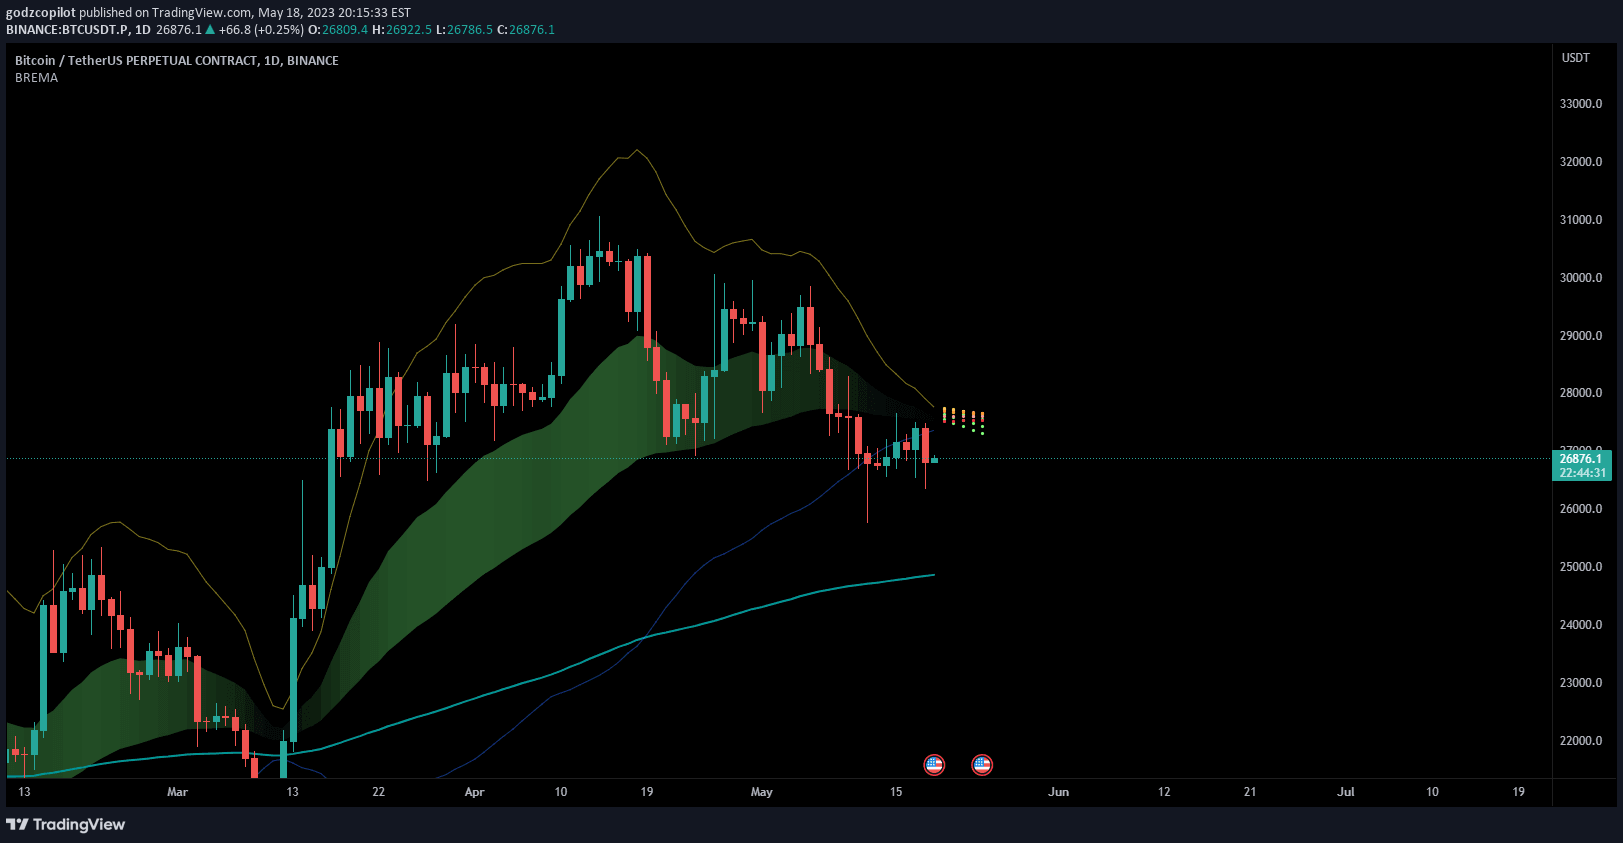
An EMA ribbon strategy using multiple exponential moving averages to analyze trend strength and momentum through gradient color visualization and ribbon separation.
Explore complementary indicator rolesHow it works
The EMA ribbon uses eight exponential moving averages ranging from shorter to longer time periods, creating a visual gradient that represents trend dynamics. Each EMA is calculated with a specific length, typically starting from 21 periods and extending to 200 periods, allowing traders to observe multiple trend perspectives simultaneously.
The ribbon's color and transparency are dynamically adjusted based on the EMA sequence and separation, providing an intuitive visualization of trend strength. Closer ribbon bands indicate stronger trend momentum, while wider separations suggest potential trend weakening or potential reversal signals.
Why it may be useful
The EMA ribbon provides traders with a comprehensive view of trend dynamics by simultaneously displaying multiple moving averages with different time lengths. This multi-dimensional approach allows traders to quickly assess trend strength, direction, and potential momentum shifts across various timeframes.
By utilizing color gradients and ribbon separation, the indicator transforms complex mathematical calculations into an easily interpretable visual representation. Traders can rapidly identify trend changes, potential entry and exit points, and overall market sentiment without extensive technical analysis.
When to explore it
The EMA ribbon strategy is most effective in trending markets with clear directional movements, particularly in liquid and volatile assets like cryptocurrencies or major stock indices. It performs optimally during strong bullish or bearish trends where multiple moving averages can confirm trend continuity and provide reliable signals.
Traders should be cautious during range-bound or choppy market conditions, as the ribbon might generate false signals or become less reliable. The indicator works best when combined with other technical analysis tools to validate trend strength and potential reversal points.
Keep exploring
What we’ve verified
Access, alerts and repainting behaviour have not been independently verified for this indicator. Check the creator’s current publication and settings.
General descriptions and classifications are recovered research. Verified details above identify the specific checks we have completed. Check the creator’s current publication for later changes.


