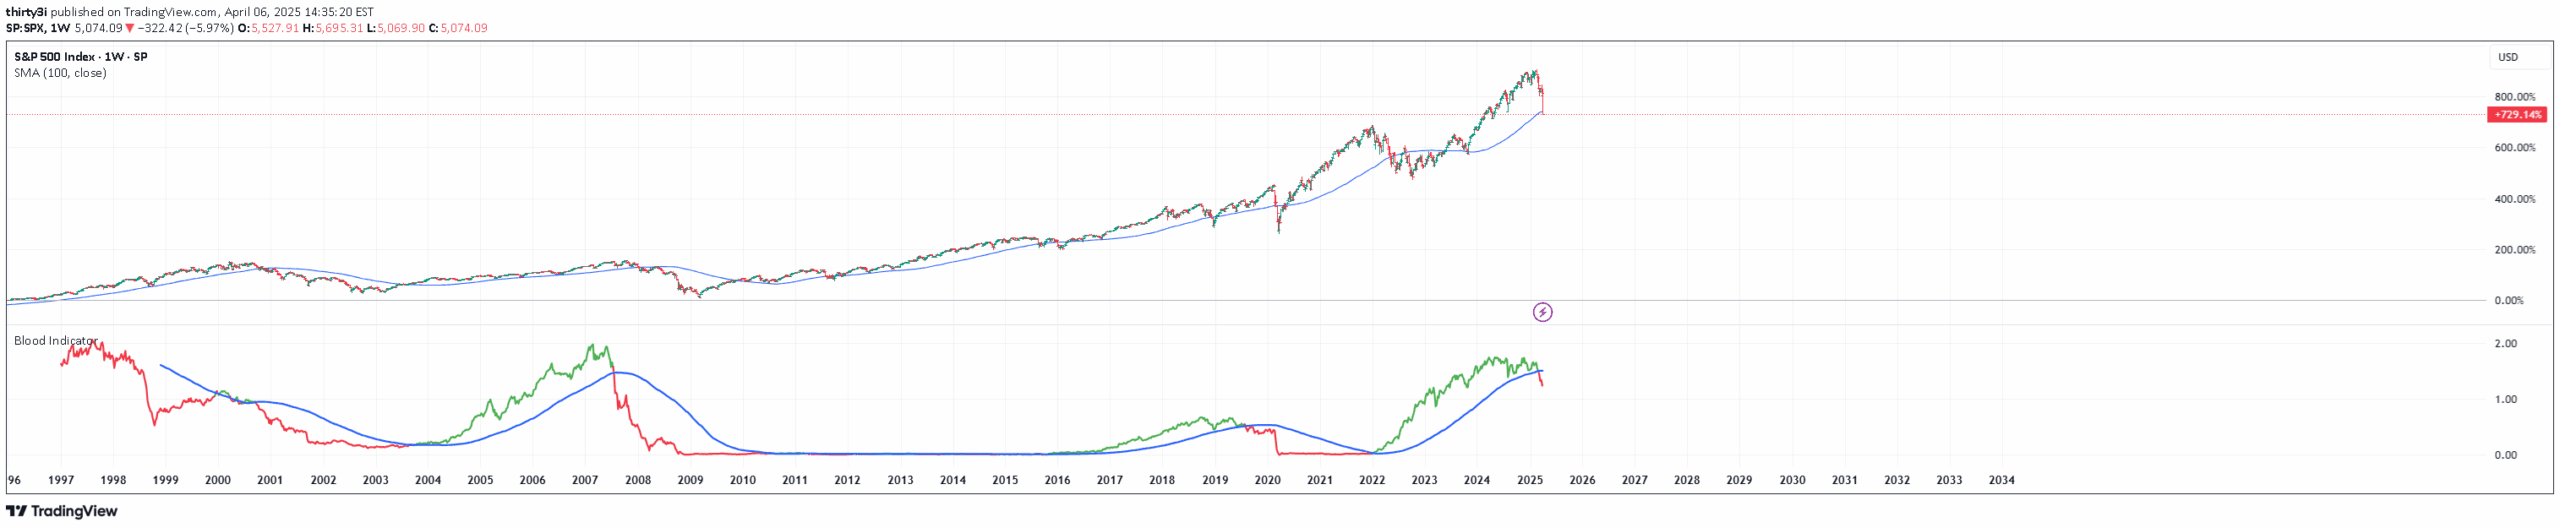
The Blood Indicator analyzes weekly Treasury Bill rates and high-yield bond spreads to predict potential market sell-offs by comparing current rates against their 100-week moving average.
Explore complementary indicator rolesHow it works
The Blood Indicator combines two key financial market data points: the 3-month Treasury Bill rate (FRED:TB3MS) and the high-yield bond market spread (FRED:BAMLH0A0HYM2). It plots these rates against their 100-week moving average to identify potential market turning points.
When the indicator turns red, it suggests a potential market sell-off is imminent. Traders use this visual signal as a warning sign for potential market downturns. The indicator requires careful interpretation and should not be used in isolation. Confluence with other price action indicators is crucial for confirming potential trades
Why it may be useful
This indicator provides traders with a macro-level view of market conditions by analyzing interest rates and bond market dynamics. It helps identify potential market stress and economic shifts before they become apparent in price movements. By tracking Treasury Bill rates and high-yield bond spreads, traders can gain insights into broader economic trends.
The indicator serves as an early warning system for potential market corrections. It bridges the gap between economic indicators and trading decisions. Understanding these underlying market signals can help traders make more informed investment choices
When to explore it
The Blood Indicator works best during periods of economic uncertainty or potential market transitions. It is most effective for swing traders looking to identify longer-term market trends. Traders should use this indicator in conjunction with other technical and fundamental analysis tools.
It is particularly useful during economic cycles with changing interest rate environments. The indicator can provide valuable insights for portfolio managers and investors seeking to understand broader market dynamics. Careful interpretation and additional confirmation are essential for making trading decisions
Keep exploring
What we’ve verified
Access, alerts and repainting behaviour have not been independently verified for this indicator. Check the creator’s current publication and settings.
General descriptions and classifications are recovered research. Verified details above identify the specific checks we have completed. Check the creator’s current publication for later changes.