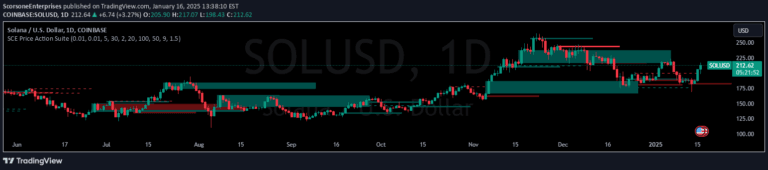
A trading signal that generates buy and sell alerts by analyzing EMA trends, stochastic oscillator levels, and price retracements to identify high-probability entry points in trending markets.
Explore complementary indicator rolesHow it works
The indicator uses two exponential moving averages (50 EMA and 200 EMA) to determine market trend direction and momentum. It identifies bullish trends when the 50 EMA is above the 200 EMA with upward slopes, and bearish trends when the 50 EMA is below the 200 EMA with downward slopes.
By incorporating the stochastic oscillator, the signal filters for oversold or overbought conditions and checks price retracements relative to recent price action. It requires price to break away from recent lows or highs by more than 1.5 ATR and be in close proximity to the 50 EMA before generating buy or sell signals.
Why it may be useful
This trading signal provides traders with a systematic approach to identifying potential entry points during strong market trends. By combining multiple technical analysis tools, it helps reduce the likelihood of false signals and improves the probability of successful trades.
The indicator's multi-layered approach integrates trend direction, momentum, price retracement, and oscillator conditions, offering traders a comprehensive framework for making more informed trading decisions across different market environments.
When to explore it
The signal is most effective in markets exhibiting clear trending conditions, where price shows consistent directional movement with well-defined momentum. Traders should prioritize using this indicator during periods of strong bullish or bearish trends, avoiding sideways or choppy market conditions.
Optimal application includes timeframes that allow for sufficient price movement and trend development, such as daily or 4-hour charts for day and swing trading. Traders should combine this signal with additional confirmation tools and risk management strategies to enhance overall trading performance.
Keep exploring
What we’ve verified
Access, alerts and repainting behaviour have not been independently verified for this indicator. Check the creator’s current publication and settings.
General descriptions and classifications are recovered research. Verified details above identify the specific checks we have completed. Check the creator’s current publication for later changes.